Deep Dive: Multichain Developers
Deep Dive: Multichain Developers - February 2026

Note: Below is the text-accessible version of this post for visually impaired readers.
Syndica Deep Dive: Multichain Developers - February 2026
How did we create our developer database?
We built our database by scanning GitHub for crypto-related open-source activity across various blockchains, using a crawler to analyze key files like package.json and Cargo.toml, and incorporating contributions from entities like Solana Labs and Jito.
We gathered repository data, extracted commits from all branches and tags, and compiled a list of contributing developers, collecting their data as well. We also filter out GitHub activity from organizations and repositories that are primarily multichain or do not clearly belong to a specific chain. For example, we drop AI-related projects that do not belong to a chain specifically (we keep Virtuals for Base, but do not include Eliza OS).
We cleaned the data by filtering out low-value activity-think inactive forks, empty projects, or those with minimal commits, bot-generated activity, etc. Our focus was on repositories and code that live on-chain or support its infrastructure, including clients, smart contracts, and RPCs, while excluding code related to projects like Dune or DeFiLlama that serve crypto but are more peripheral.
This report covers the following 10 chains: Solana, Ethereum, Base, Sui, Starknet, Arbitrum, Optimism, BSC, Berachain, and Near. Data runs through February 28th, 2026.
Classification Methodology
We classify developers into two categories-Professional and Hobbyist Developer - based on their activity patterns using a decision tree classifier. Our model analyzes three key aspects of developer behavior:
- Activity: Volume of recent work (commits, lines of code, pull requests, reviews)
- Depth: Breadth of contributions across repositories, ecosystems, and programming languages
- Tenure: Consistency of engagement over time
We trained the model using an active learning process, where the algorithm identifies the most informative cases to label next. After training the model, we use it to classify developers across chains on a monthly basis.
This classification enables us to focus our analysis on developers who make meaningful contributions to each ecosystem.
Part I Developer Growth
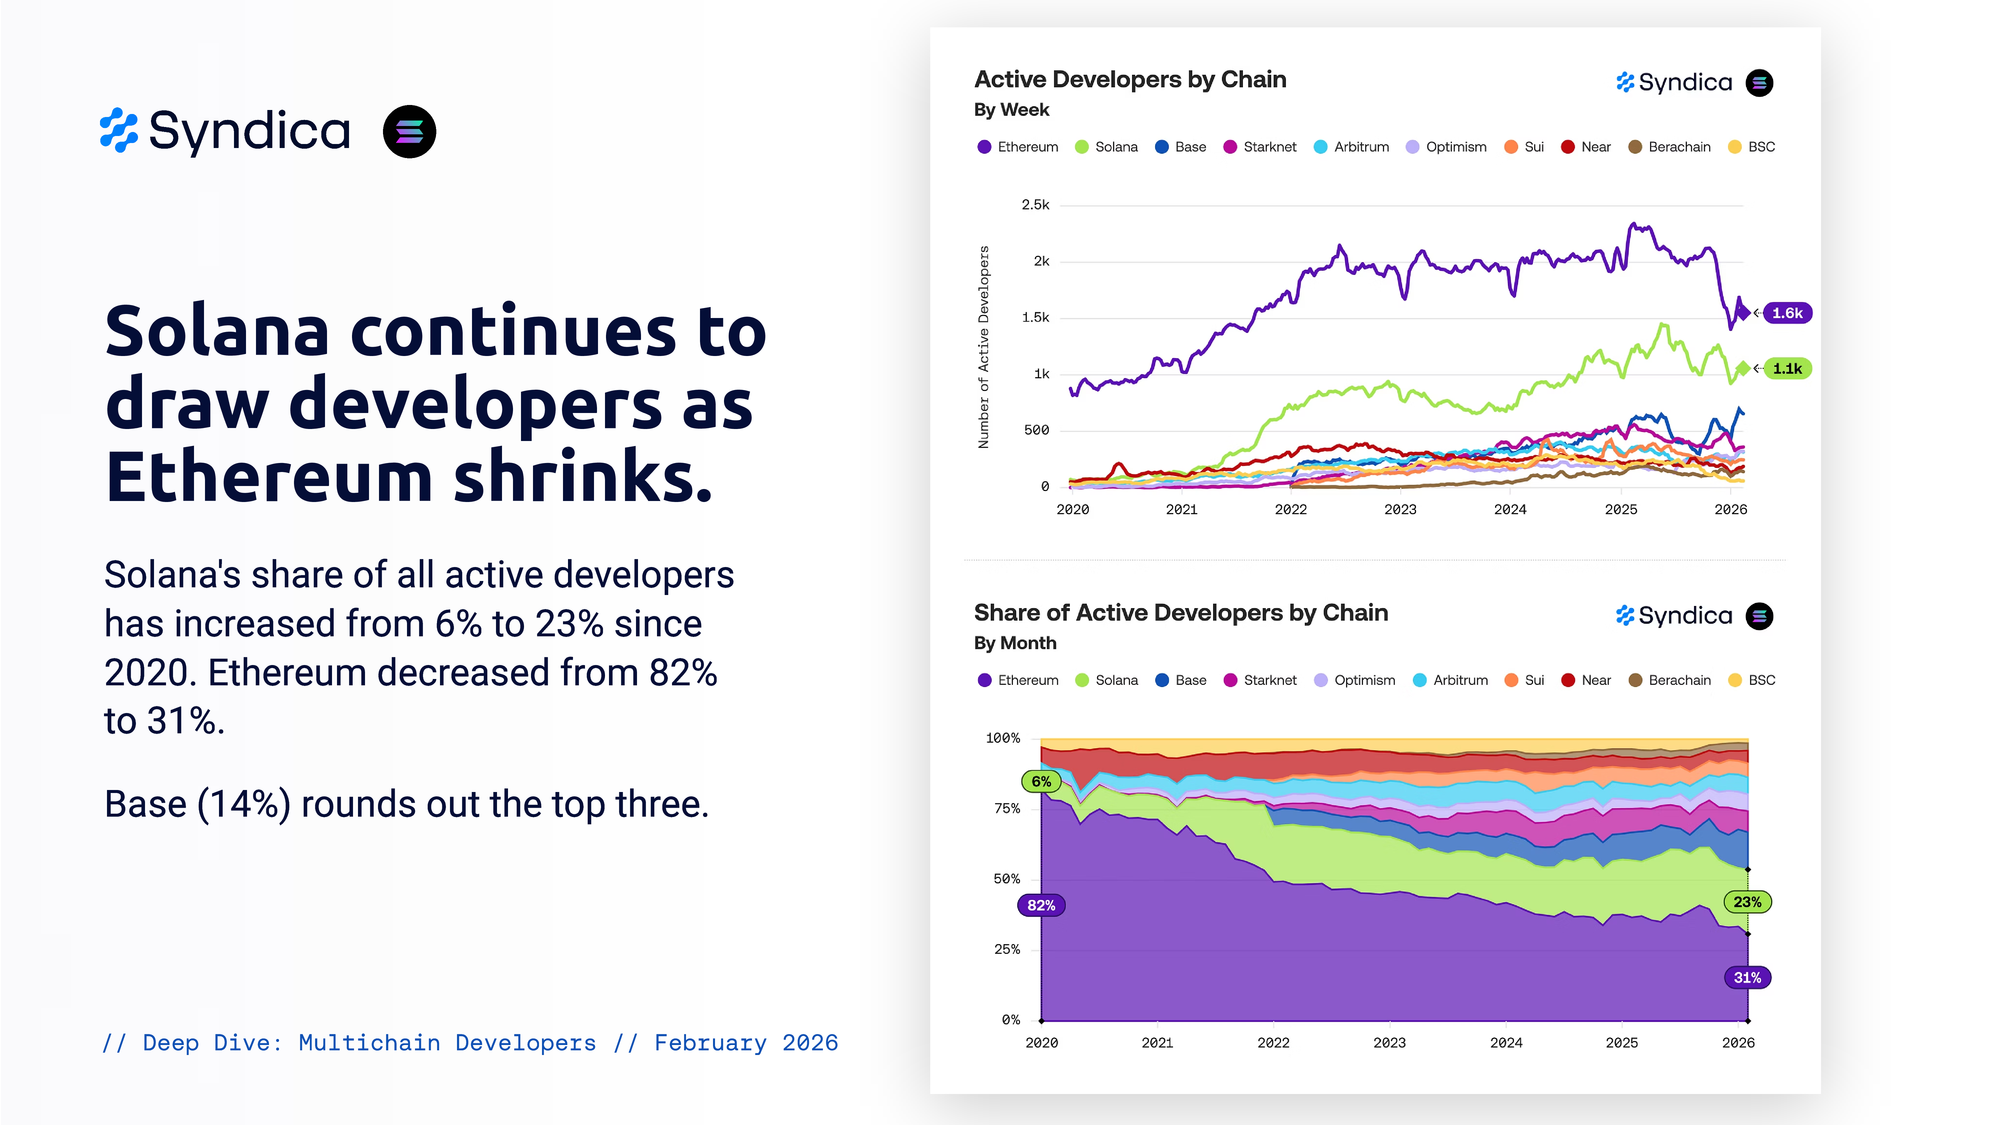
Solana continues to draw developers as Ethereum shrinks.
Solana's share of all active developers has increased from 6% to 23% since 2020. Ethereum decreased from 82% to 31%. Base (14%) rounds out the top three.
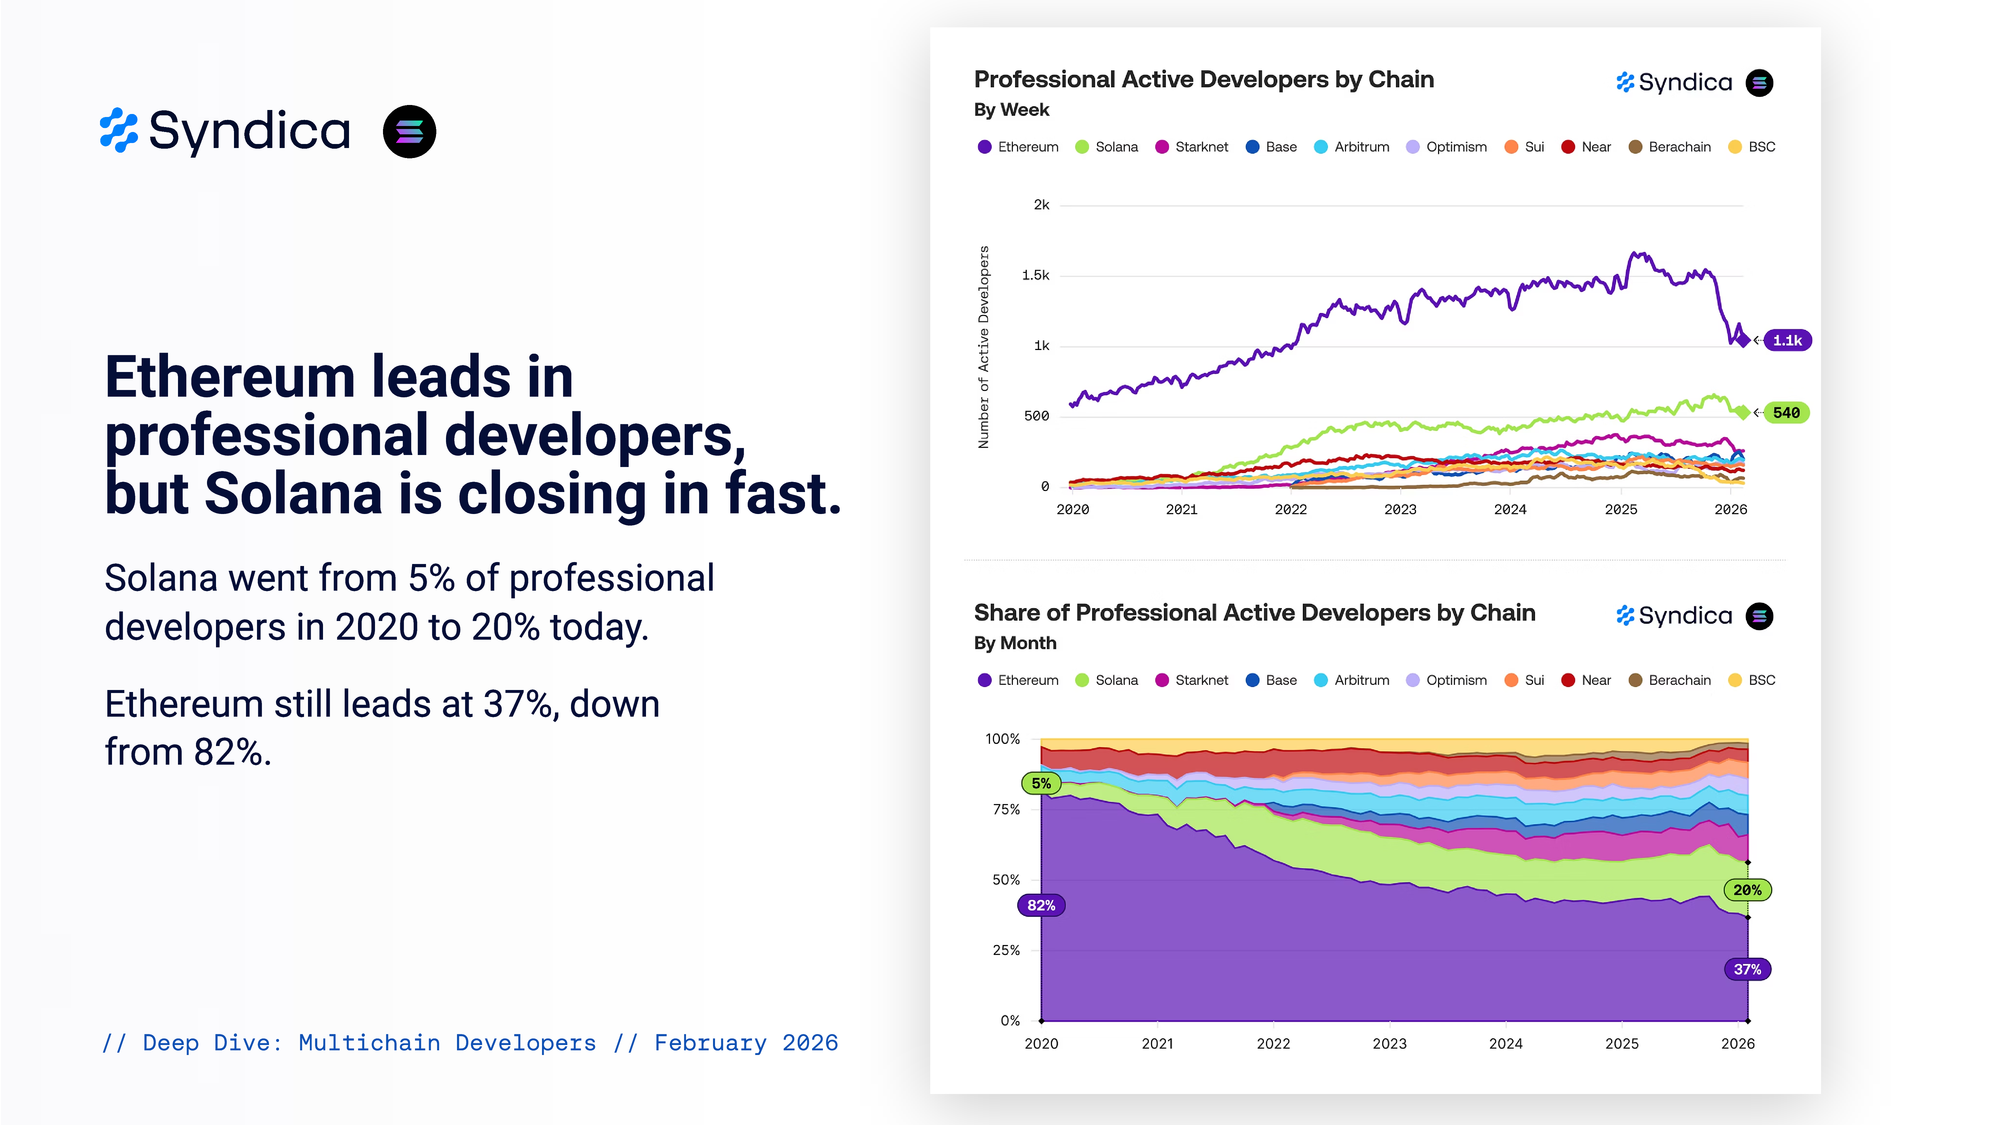
Ethereum leads in professional developers, but Solana is closing in fast.
Solana went from 5% of professional developers in 2020 to 20% today. Ethereum still leads at 37%, down from 82%.
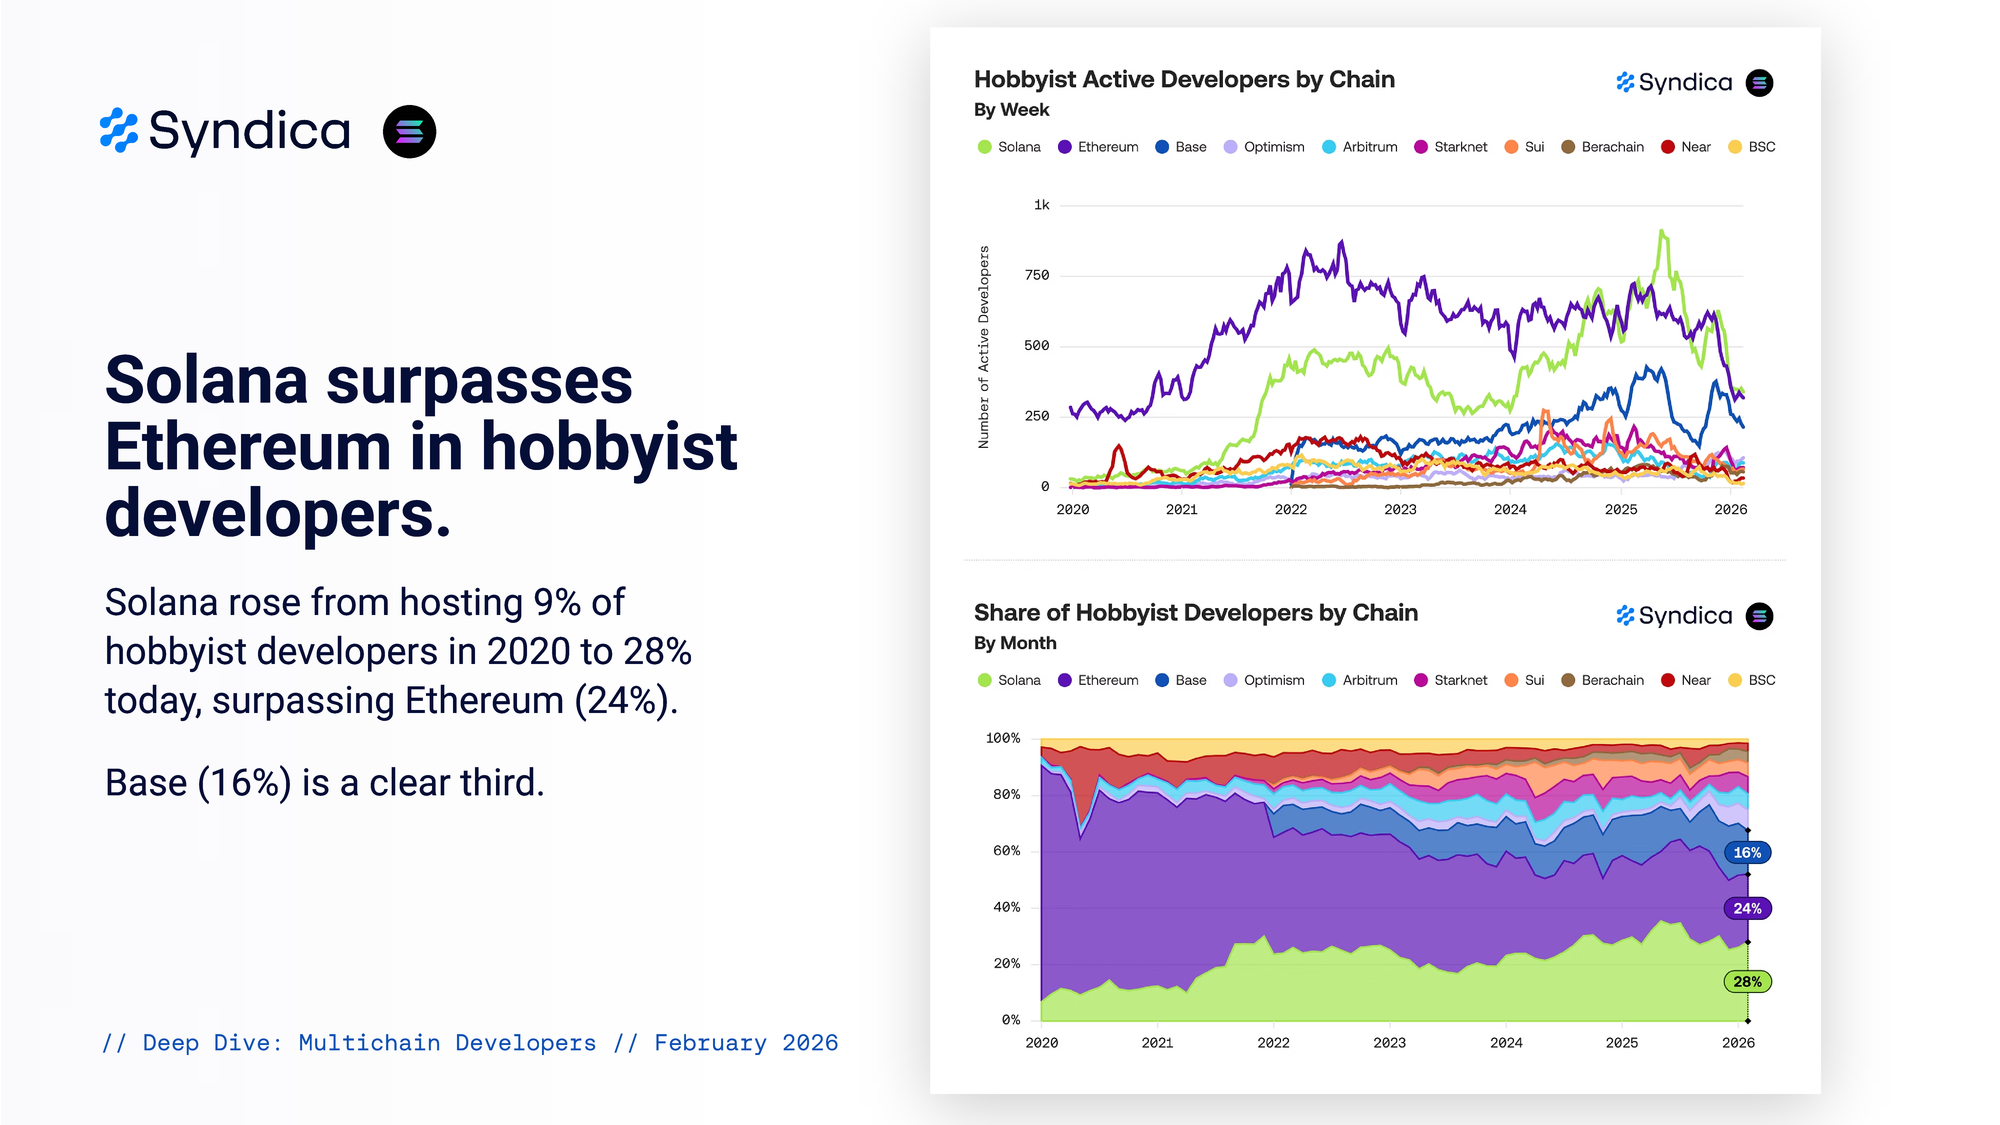
Solana surpasses Ethereum in hobbyist developers.
Solana rose from hosting 9% of hobbyist developers in 2020 to 28% in 2025, surpassing Ethereum (24%). Base (16%) is a clear third.
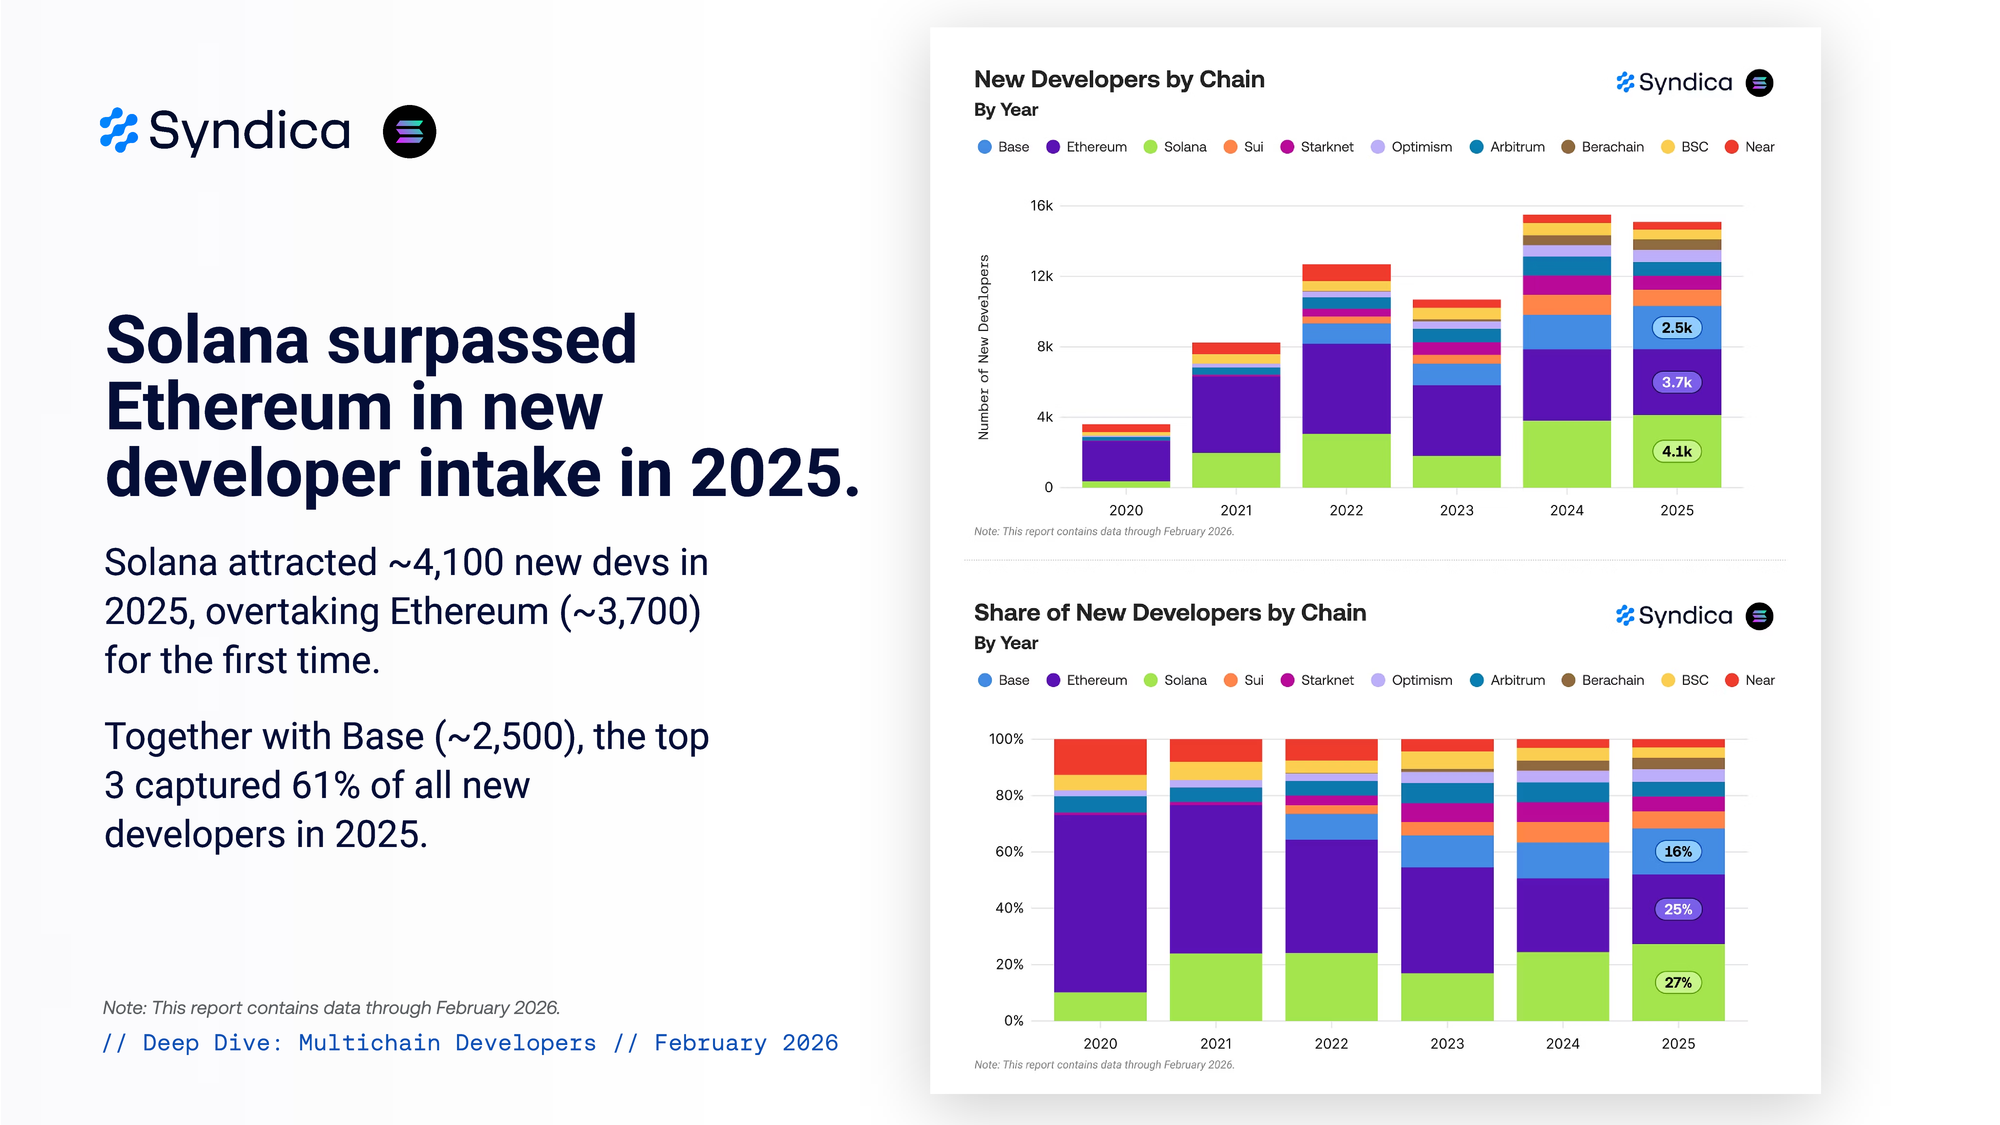
Solana surpassed Ethereum in new developer intake in 2025.
Solana attracted ~4,100 new devs in 2025, overtaking Ethereum (~3,700) for the first time. Together with Base (~2,500), the top 3 captured 61% of all new developers in 2025.
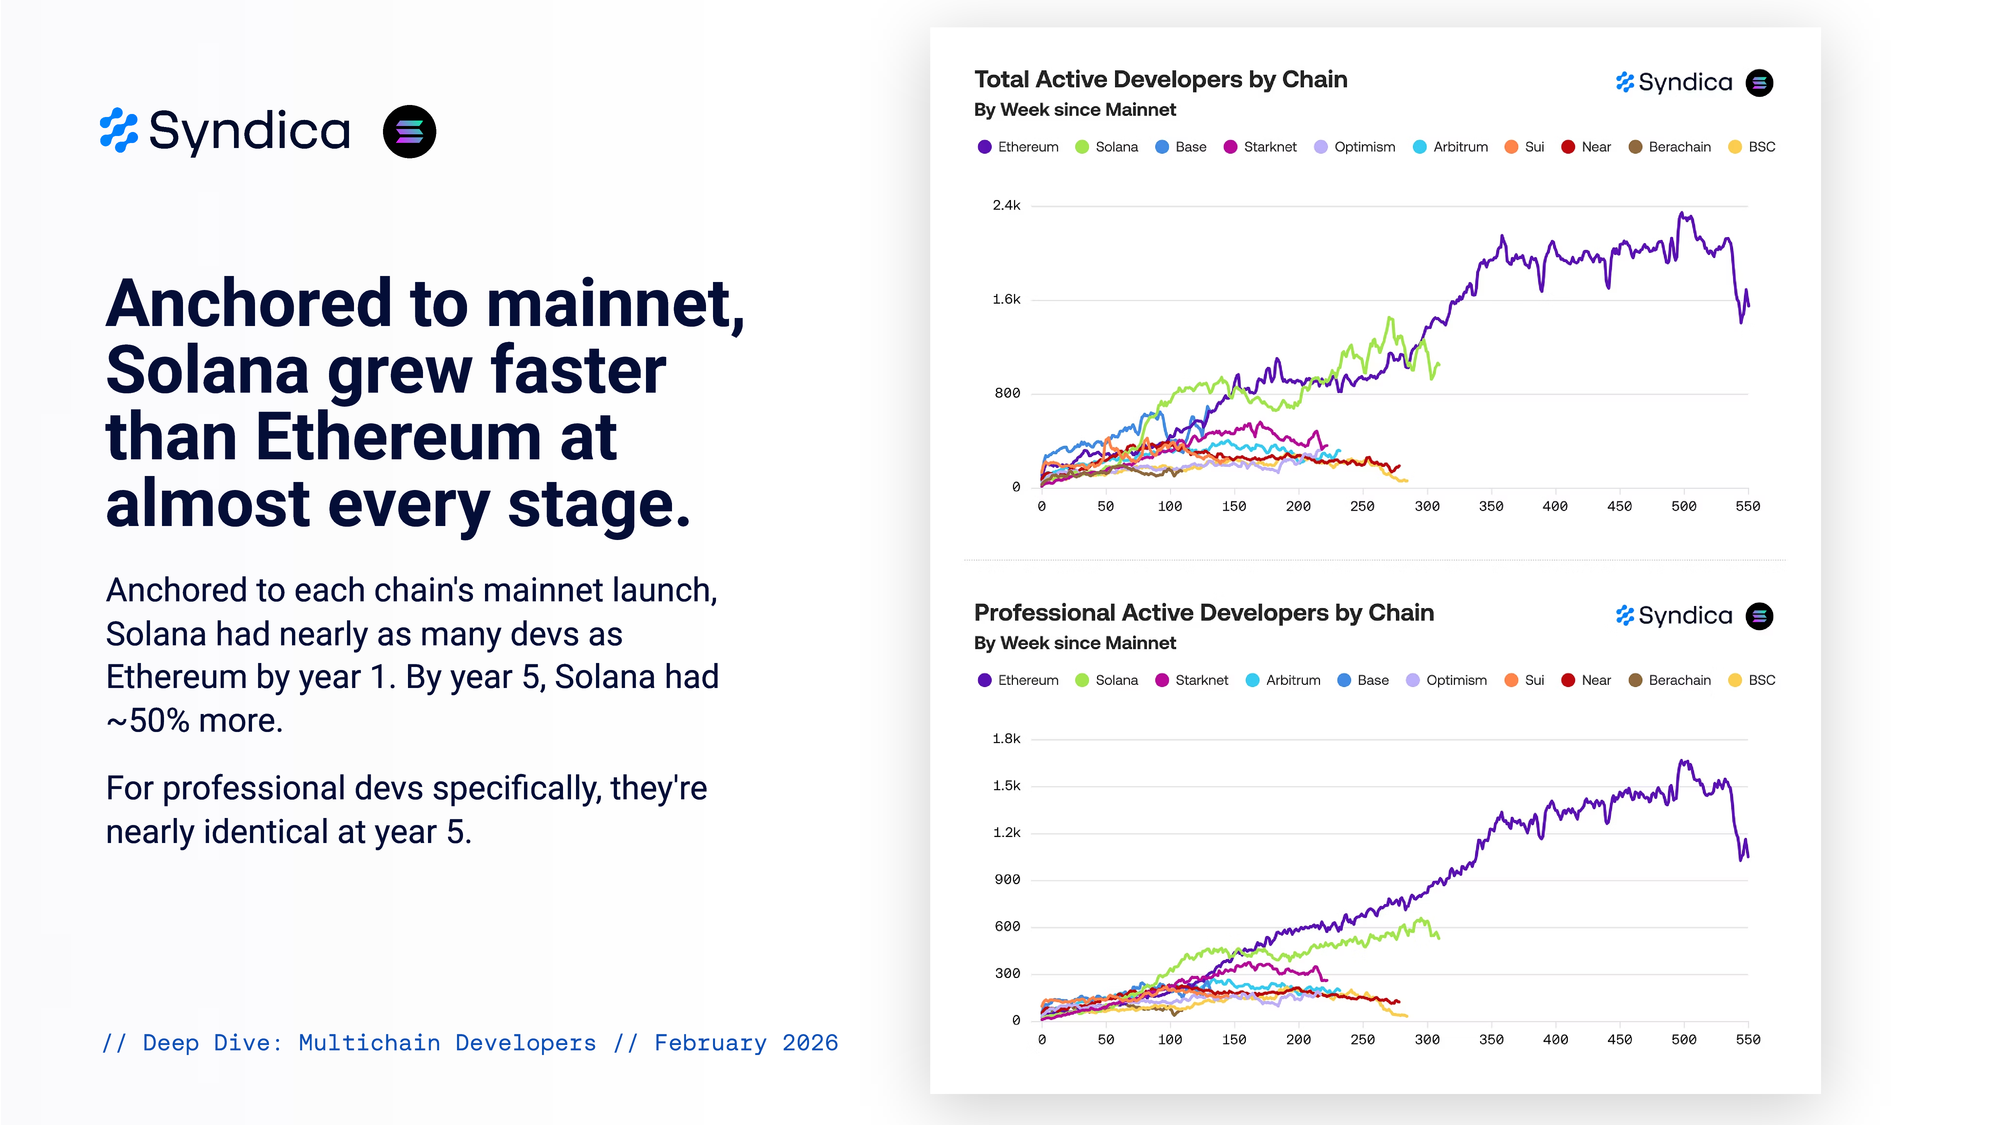
Anchored to mainnet, Solana grew faster than Ethereum at almost every stage.
Anchored to each chain's mainnet launch, Solana had nearly as many devs as Ethereum by year 1. By year 5, Solana had ~50% more. For professional devs specifically, they're nearly identical at year 5.
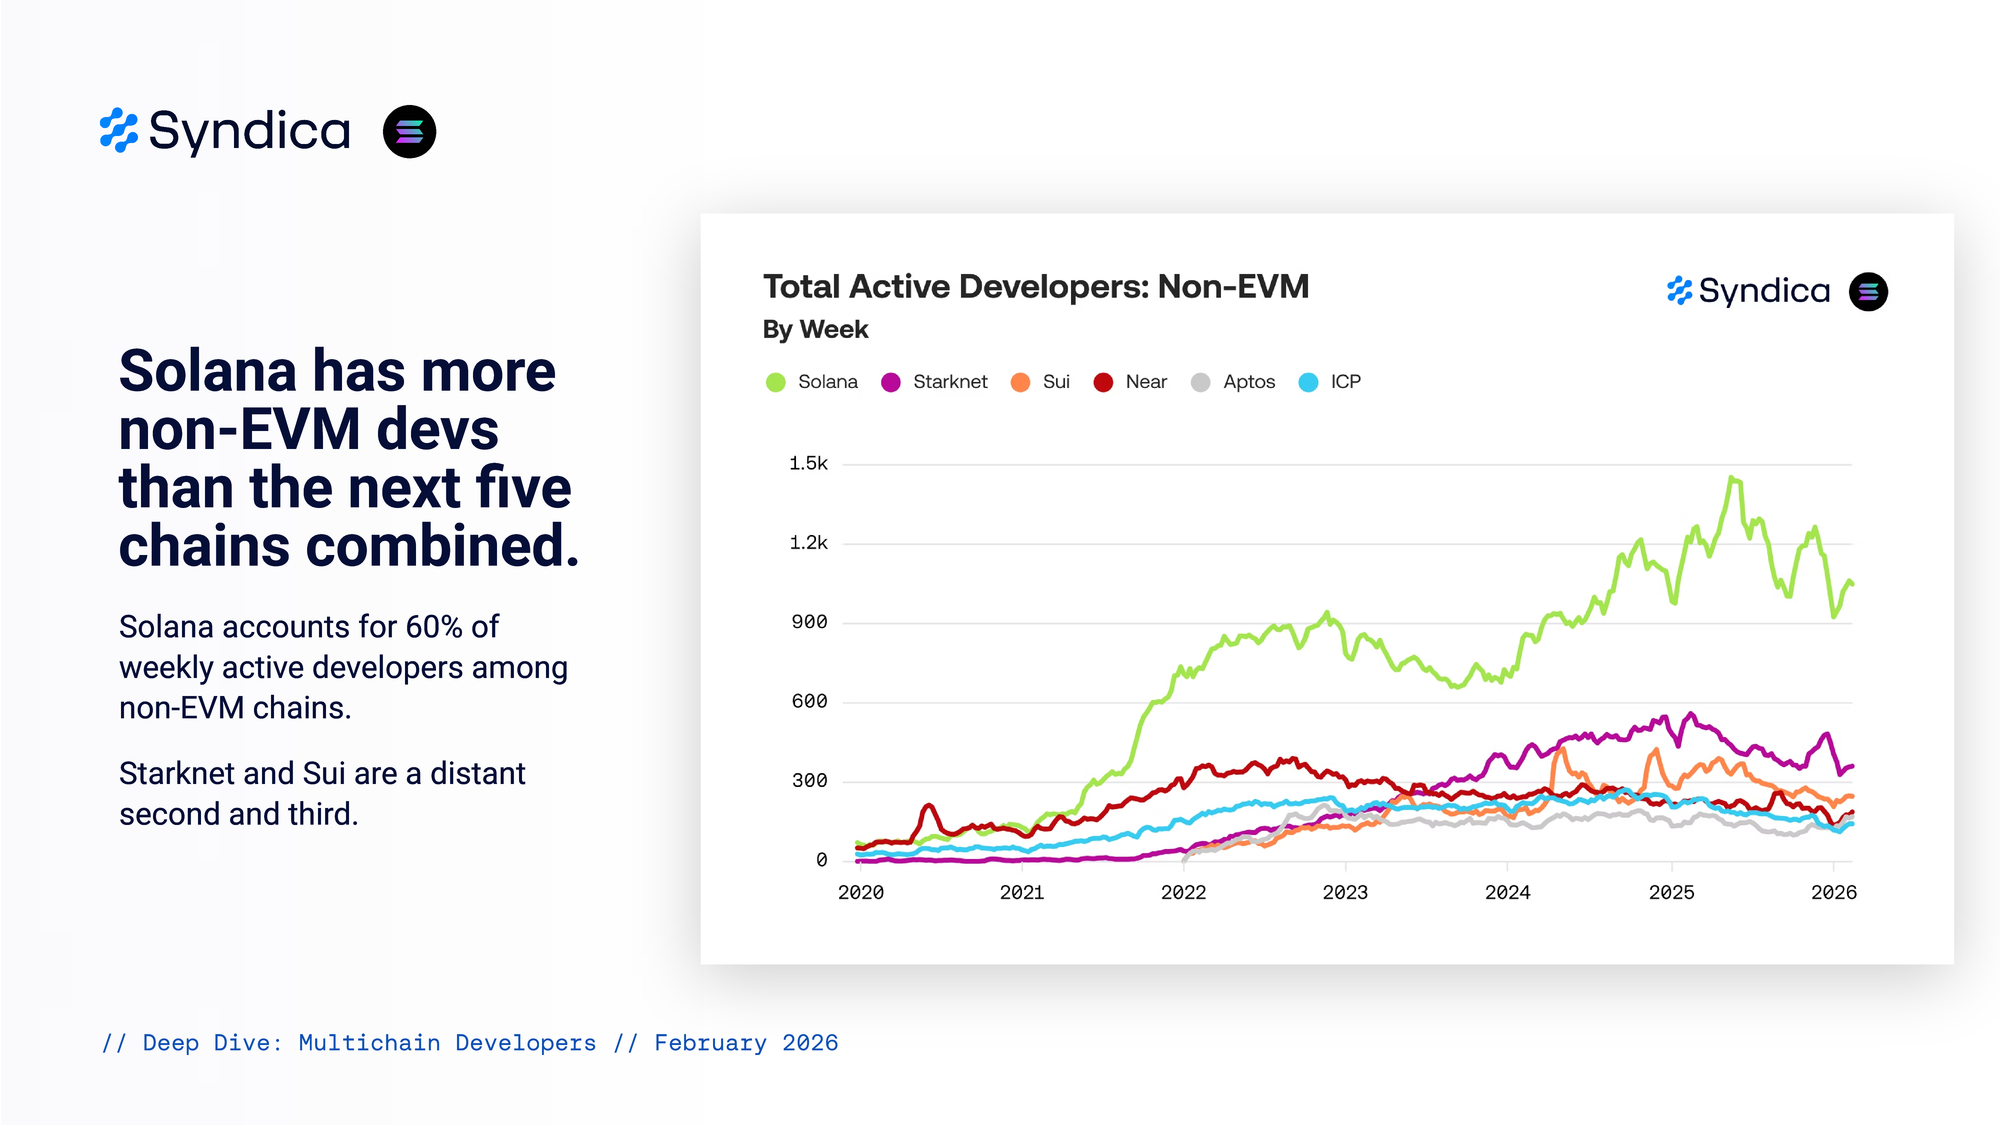
Solana has more non-EVM devs than the next five chains combined.
Solana accounts for 60% of weekly active developers among non-EVM chains. Starknet and Sui are a distant second and third.
Part II Developer Profiles
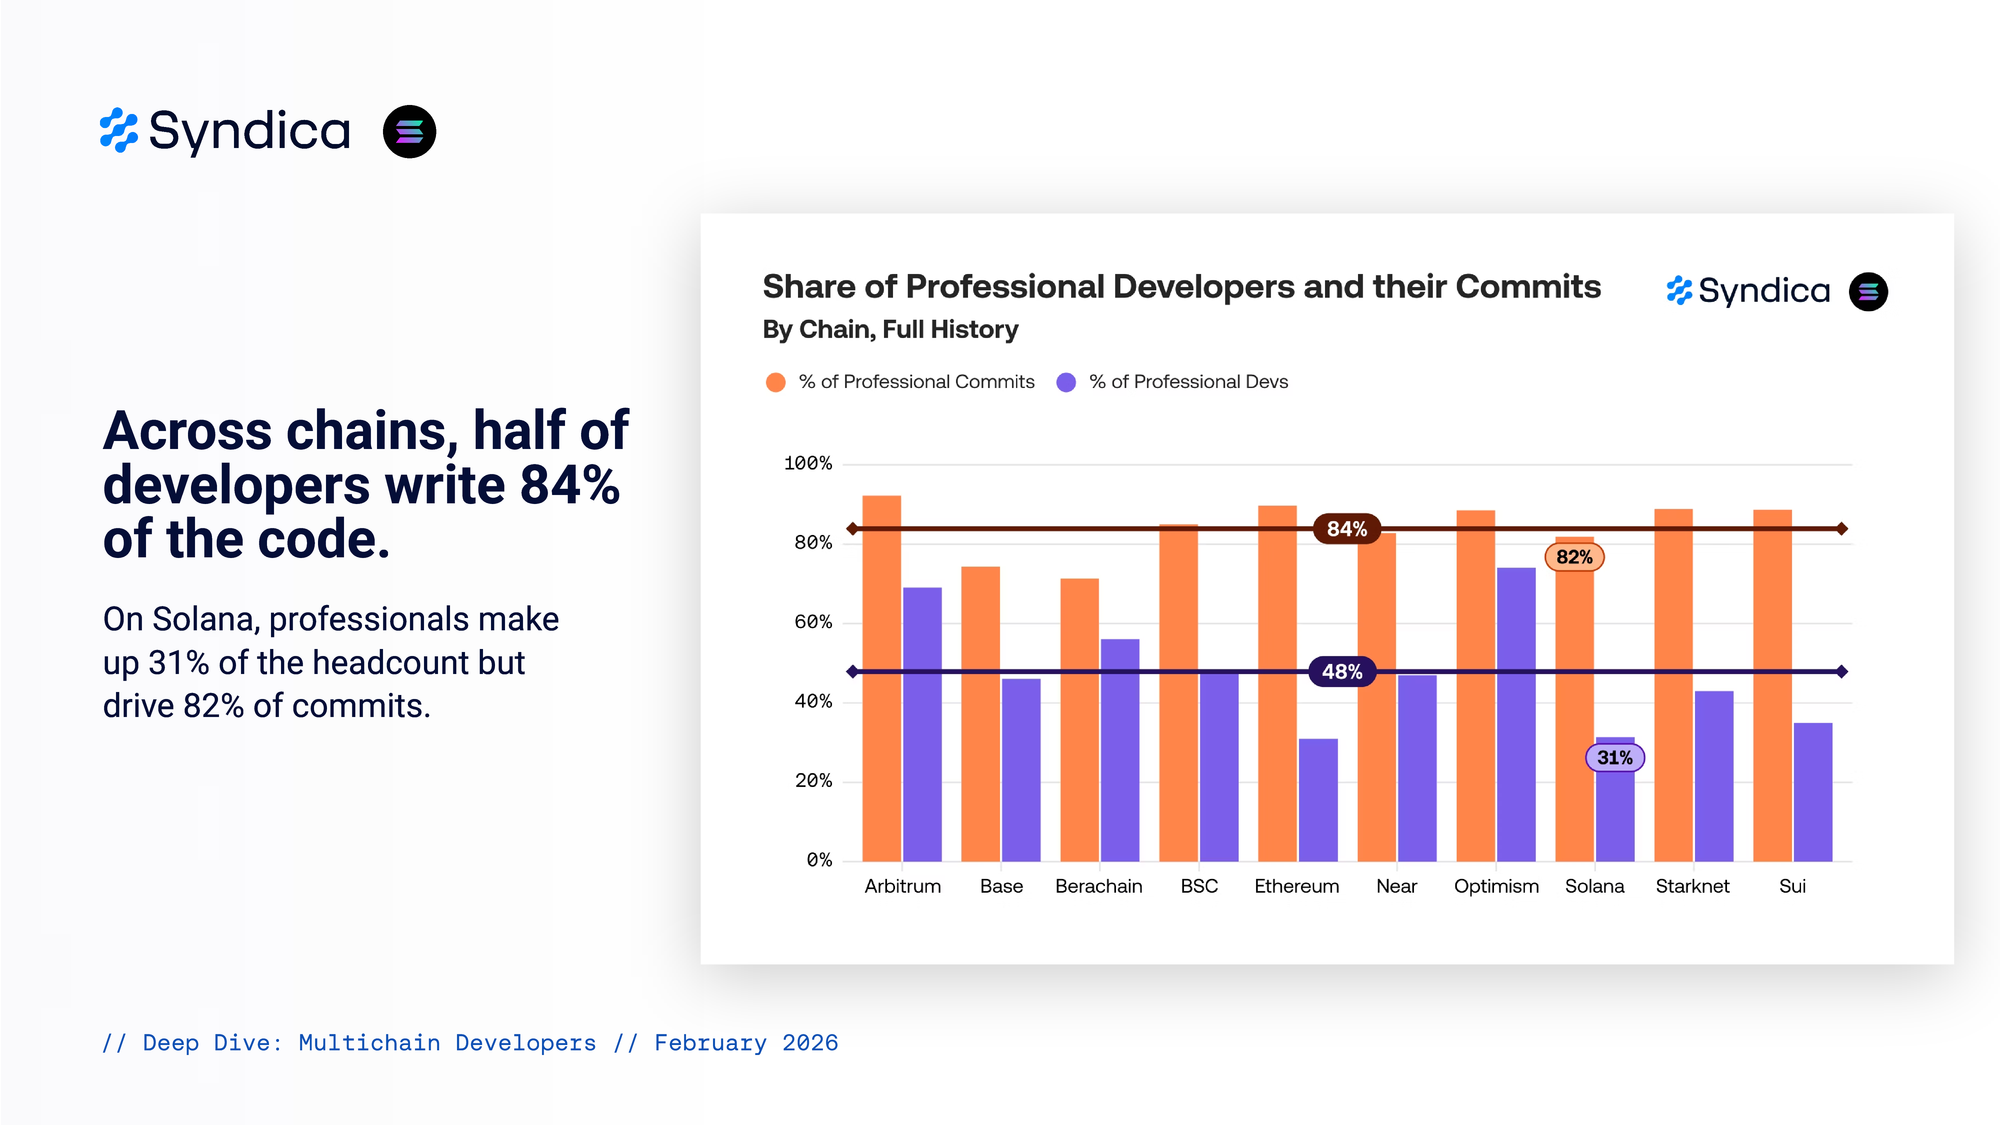
Across chains, half of developers write 84% of the code.
On Solana, professionals make up 31% of the headcount but drive 82% of commits.
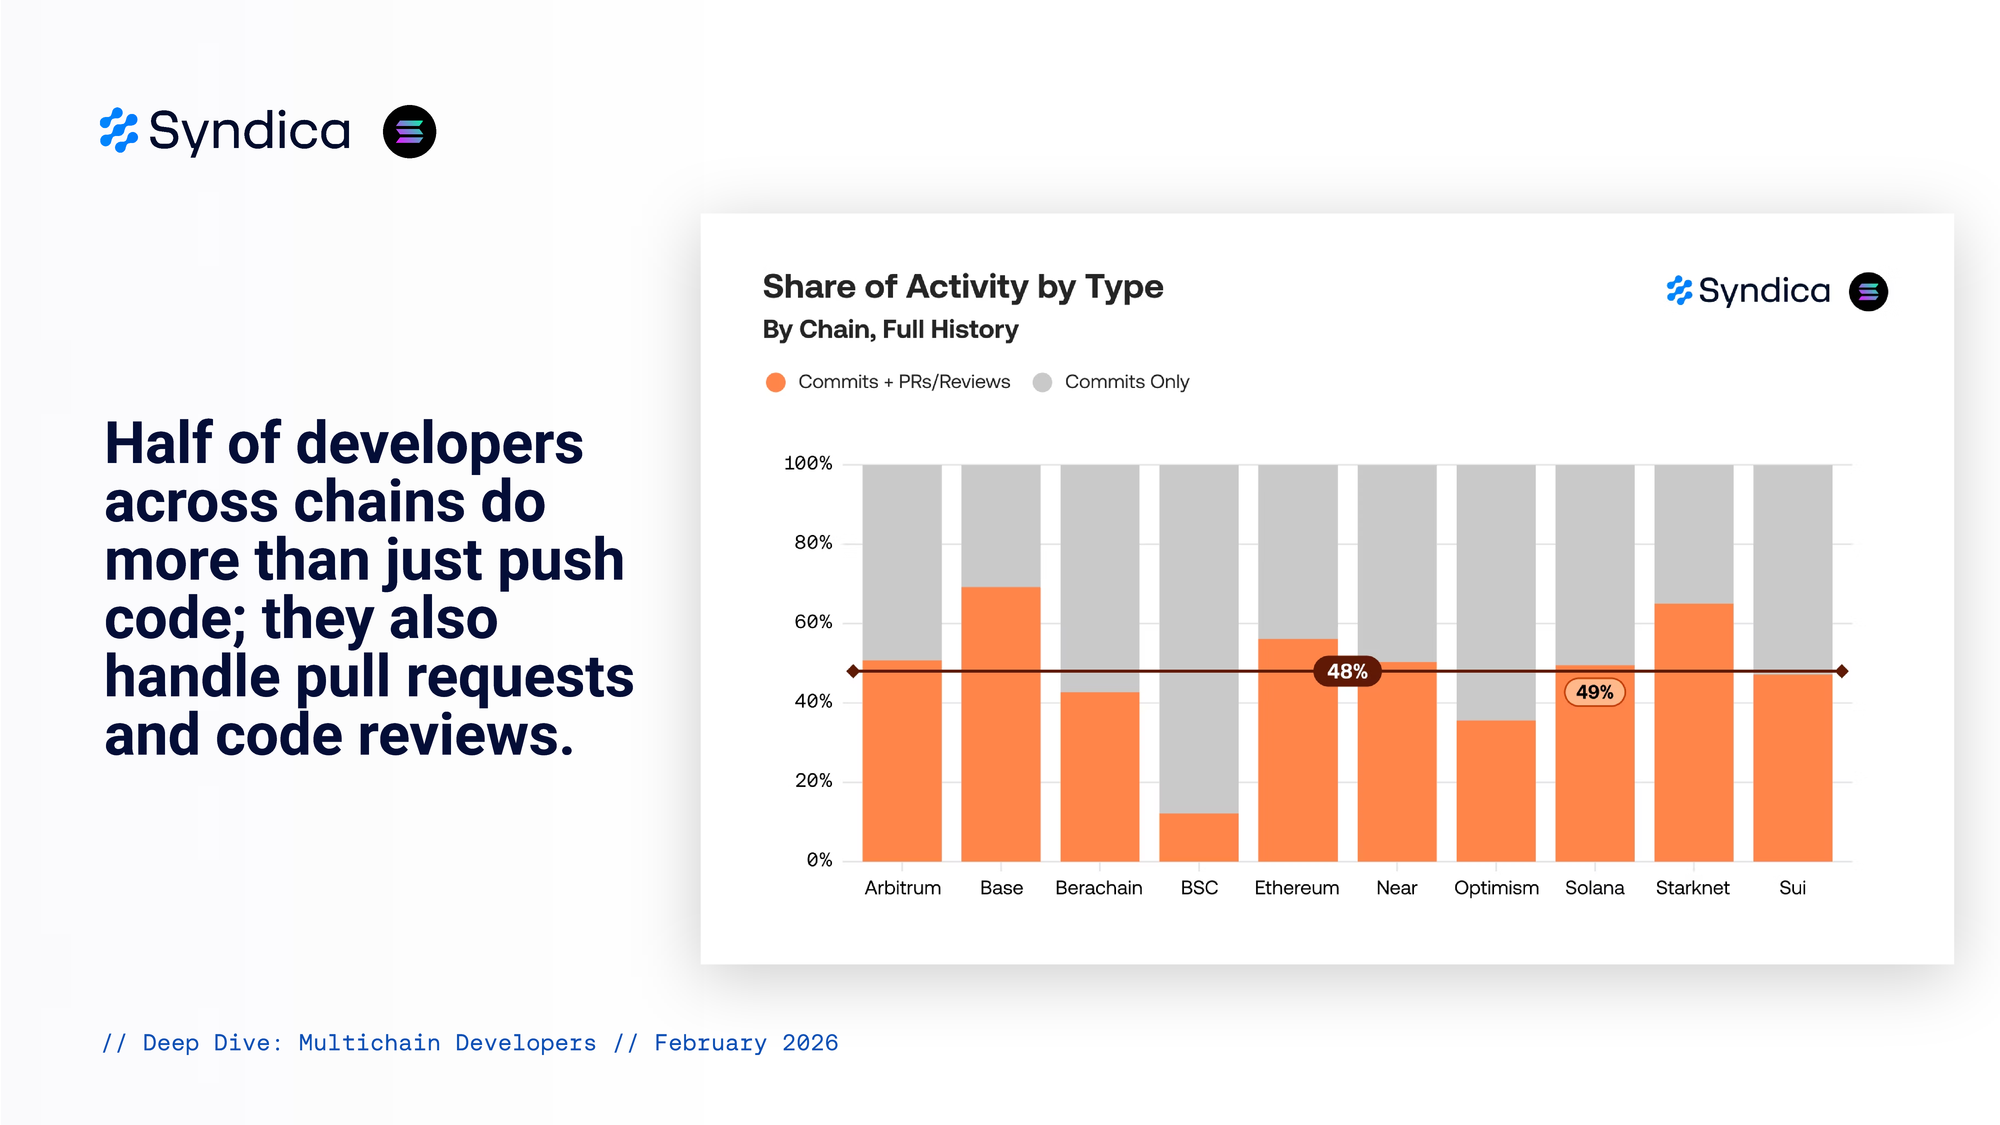
Half of developers across chains do more than just push code; they also handle pull requests and code reviews.
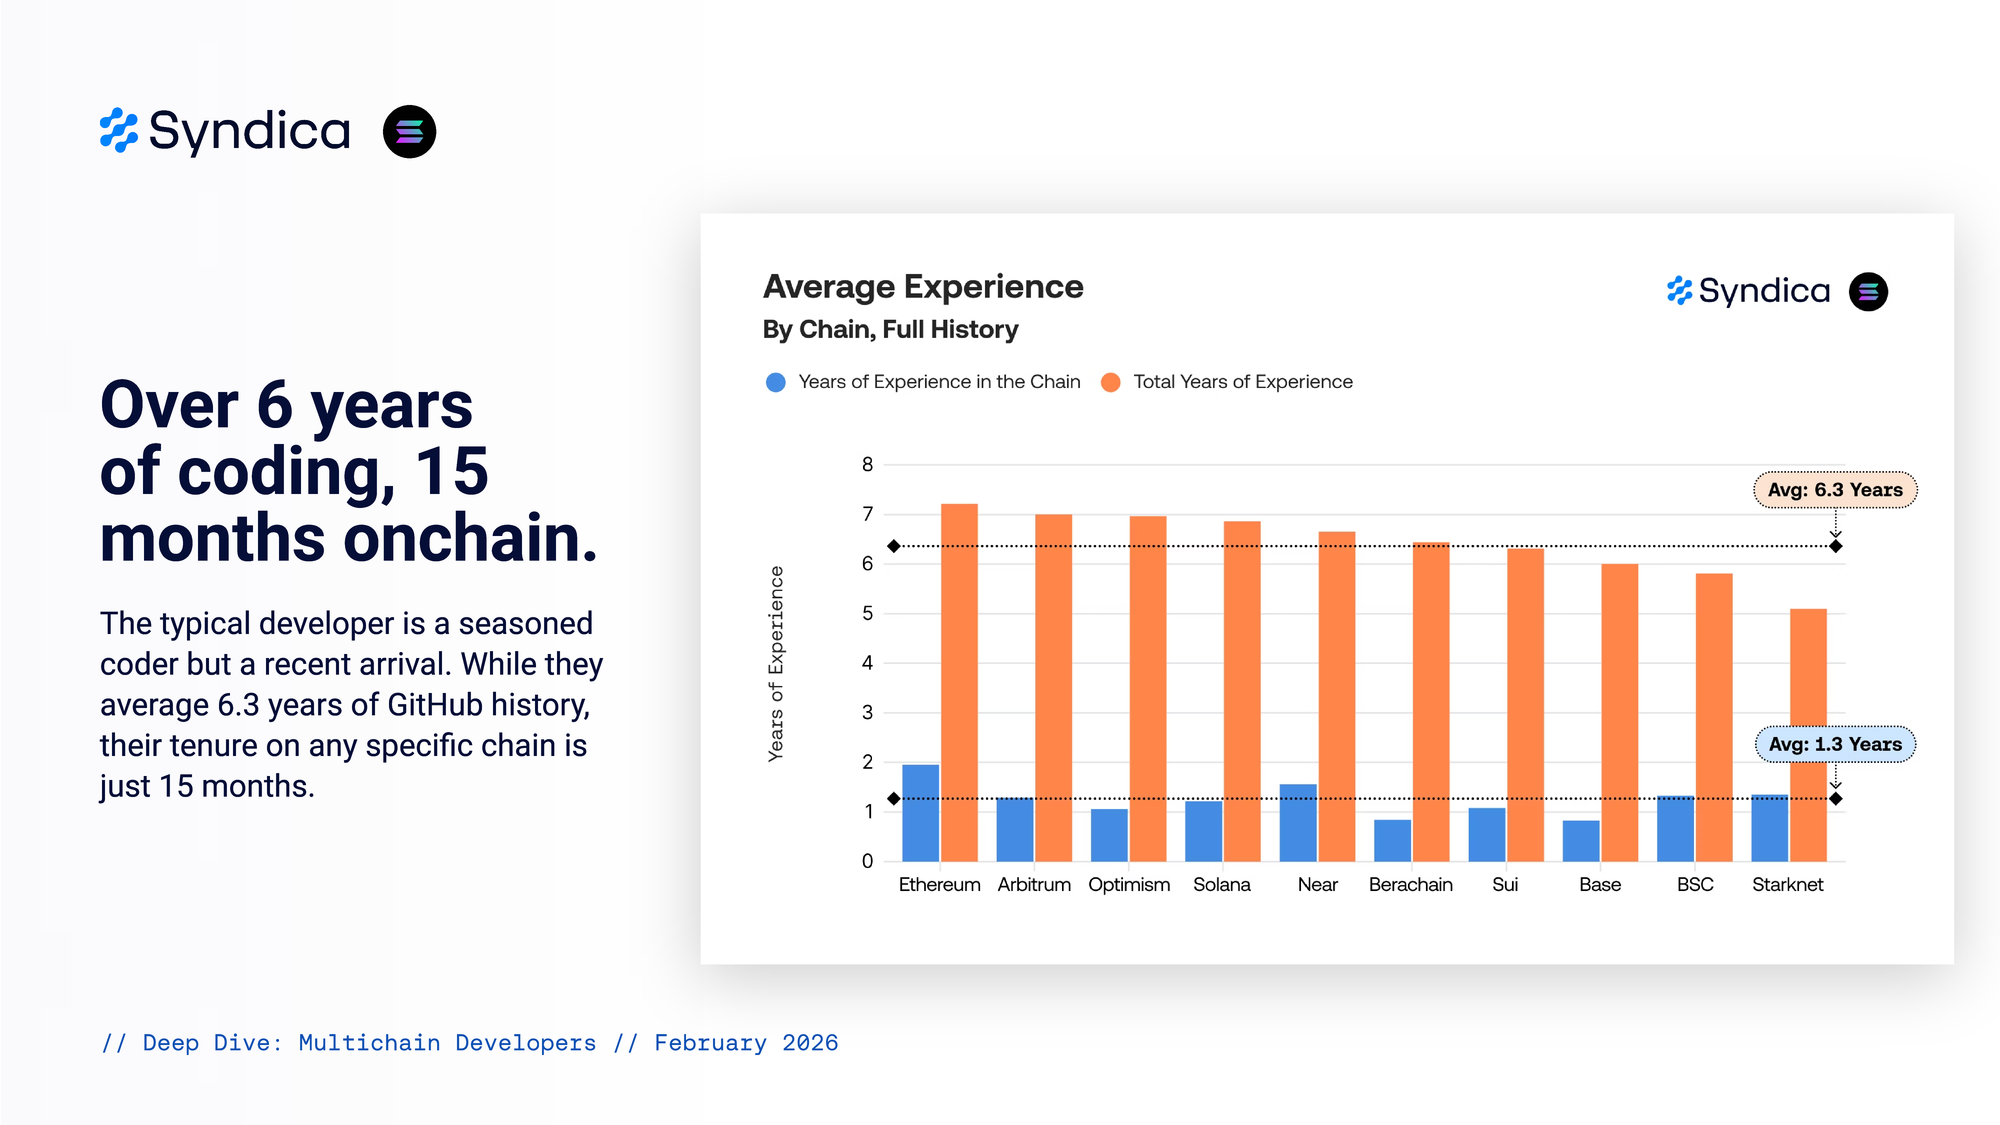
Over 6 years of coding, 15 months onchain.
The typical developer is a seasoned coder but a recent arrival. While they average 6.3 years of GitHub history, their tenure on any specific chain is just 15 months.
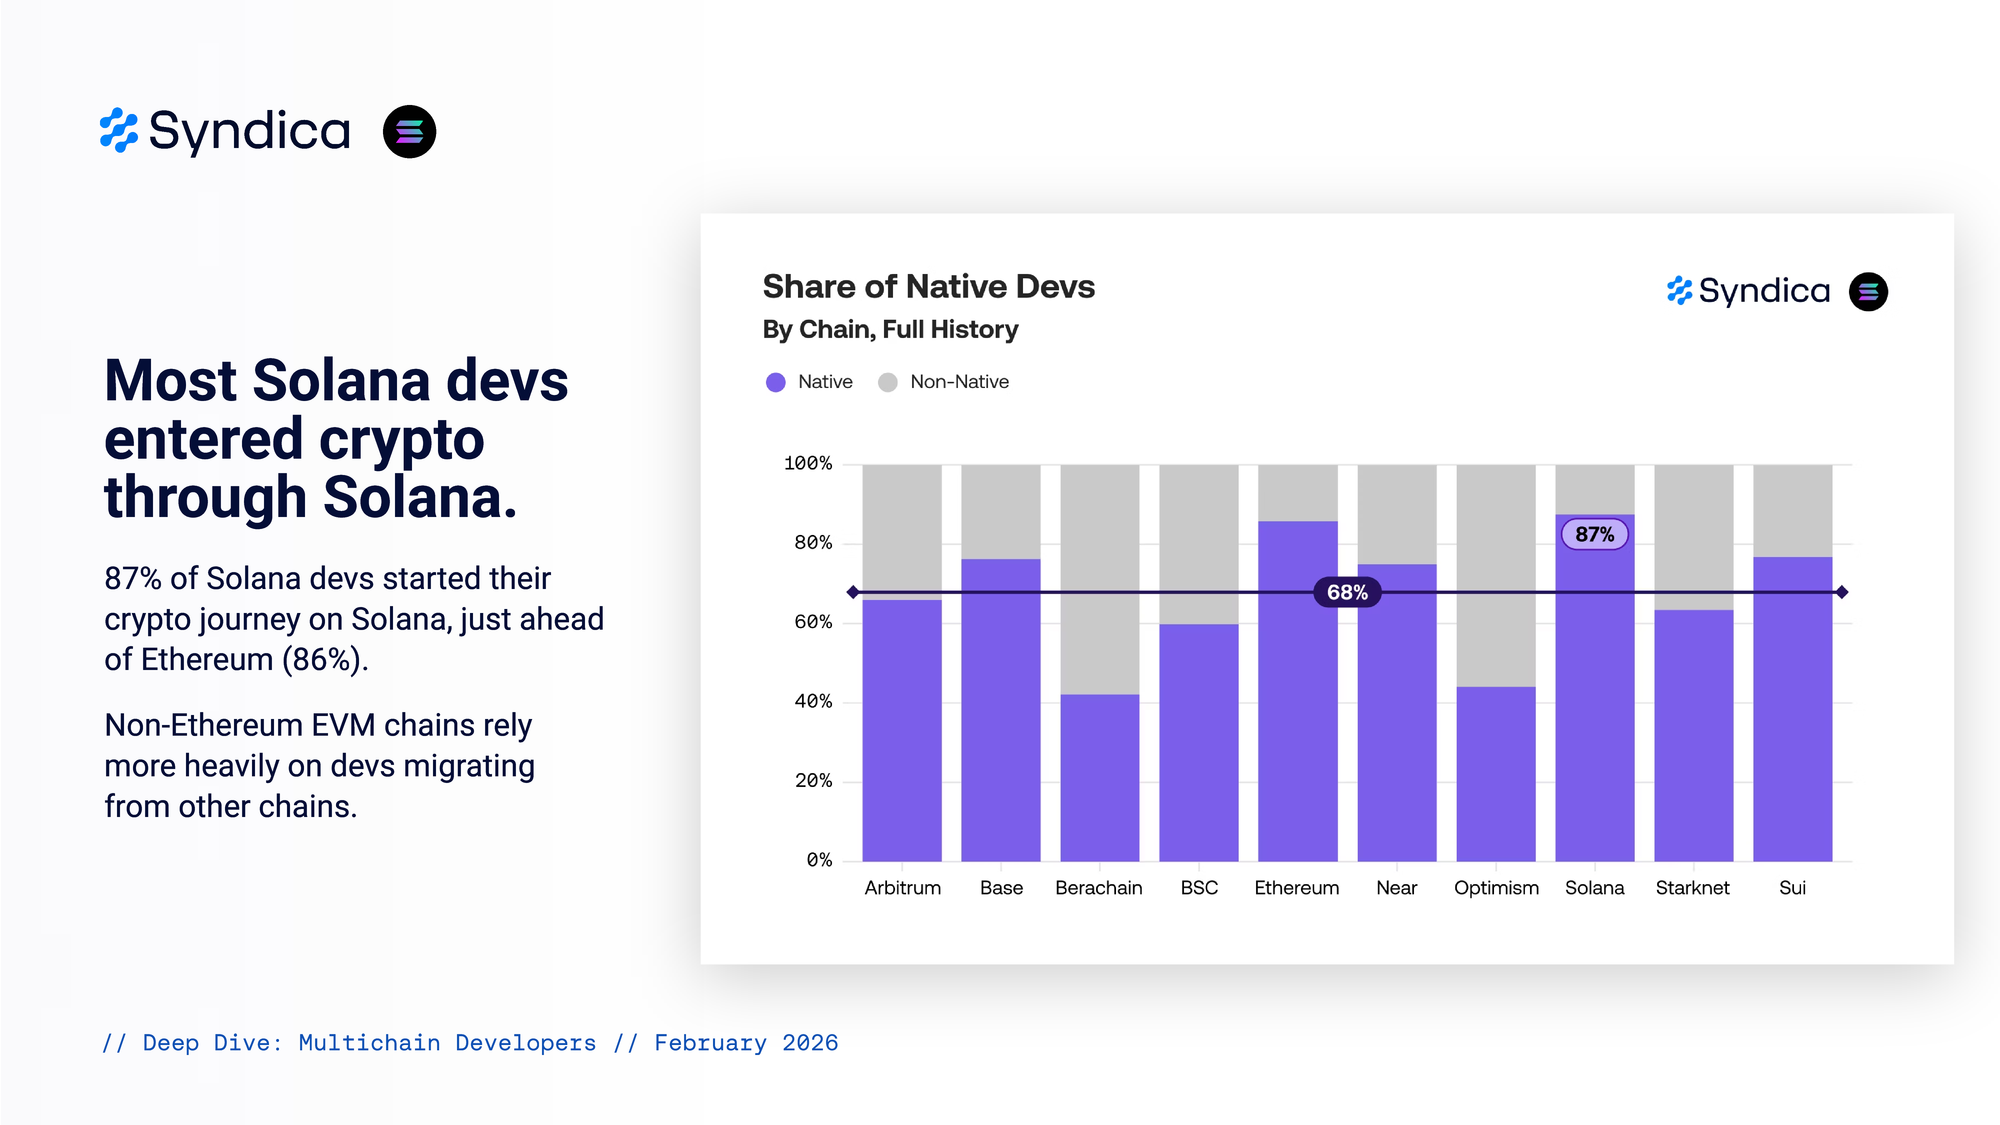
Most Solana devs entered crypto through Solana.
87% of Solana devs started their crypto journey on Solana, just ahead of Ethereum (86%). Non-Ethereum EVM chains rely more heavily on devs migrating from other chains.
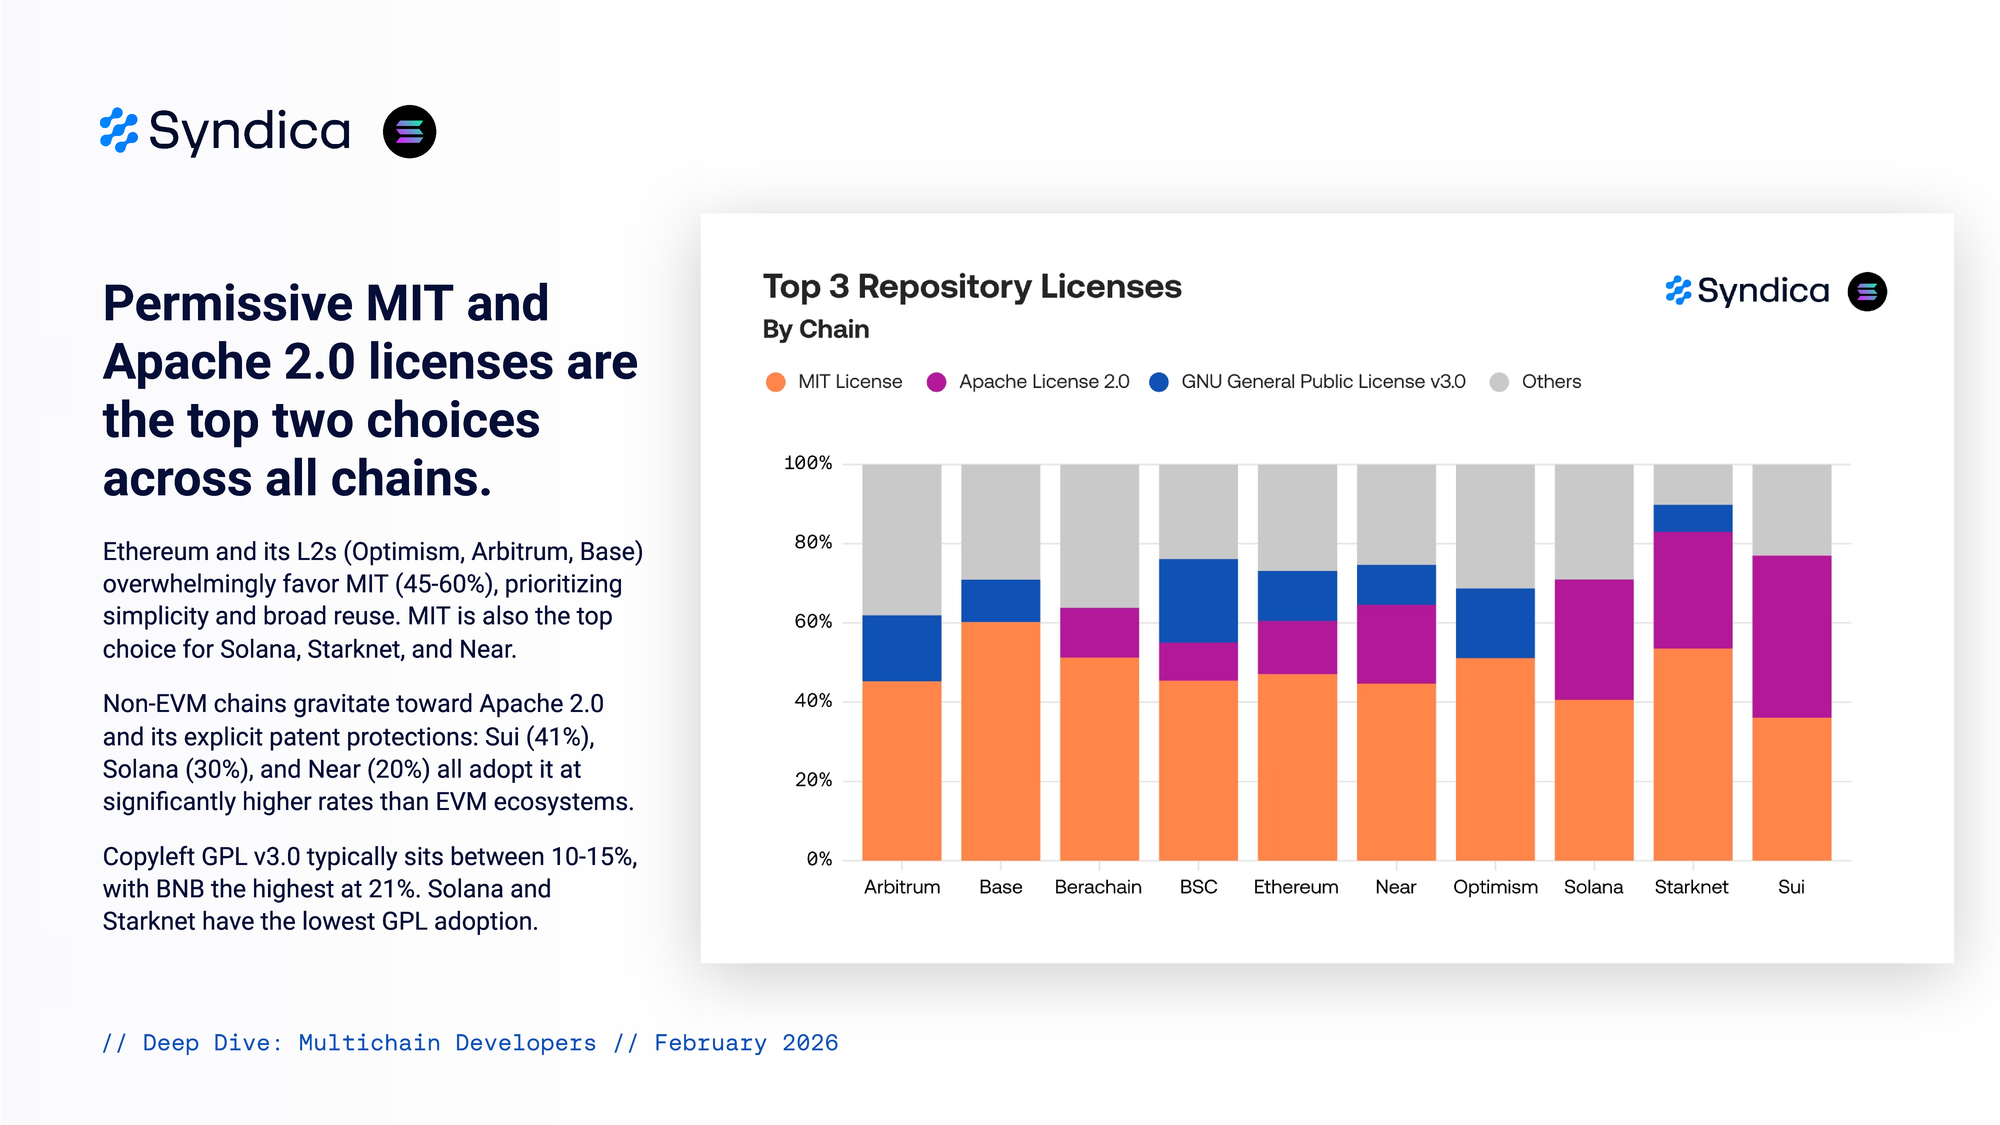
Permissive MIT and Apache 2.0 licenses are the top two choices across all chains.
Ethereum and its L2s (Optimism, Arbitrum, Base) overwhelmingly favor MIT (~50%), prioritizing simplicity and broad reuse. MIT is also the top choice for Solana devs. Newer non-EVM chains like Solana, Sui and Starknet prefer the Apache 2.0 license (30-40%), which grants explicit patent rights for novel architectures. Copyleft GPL v3.0 typically sits between 10-15%. Solana and Starknet have the lowest GPL adoption at around 6%.
Part III Developer Behaviour
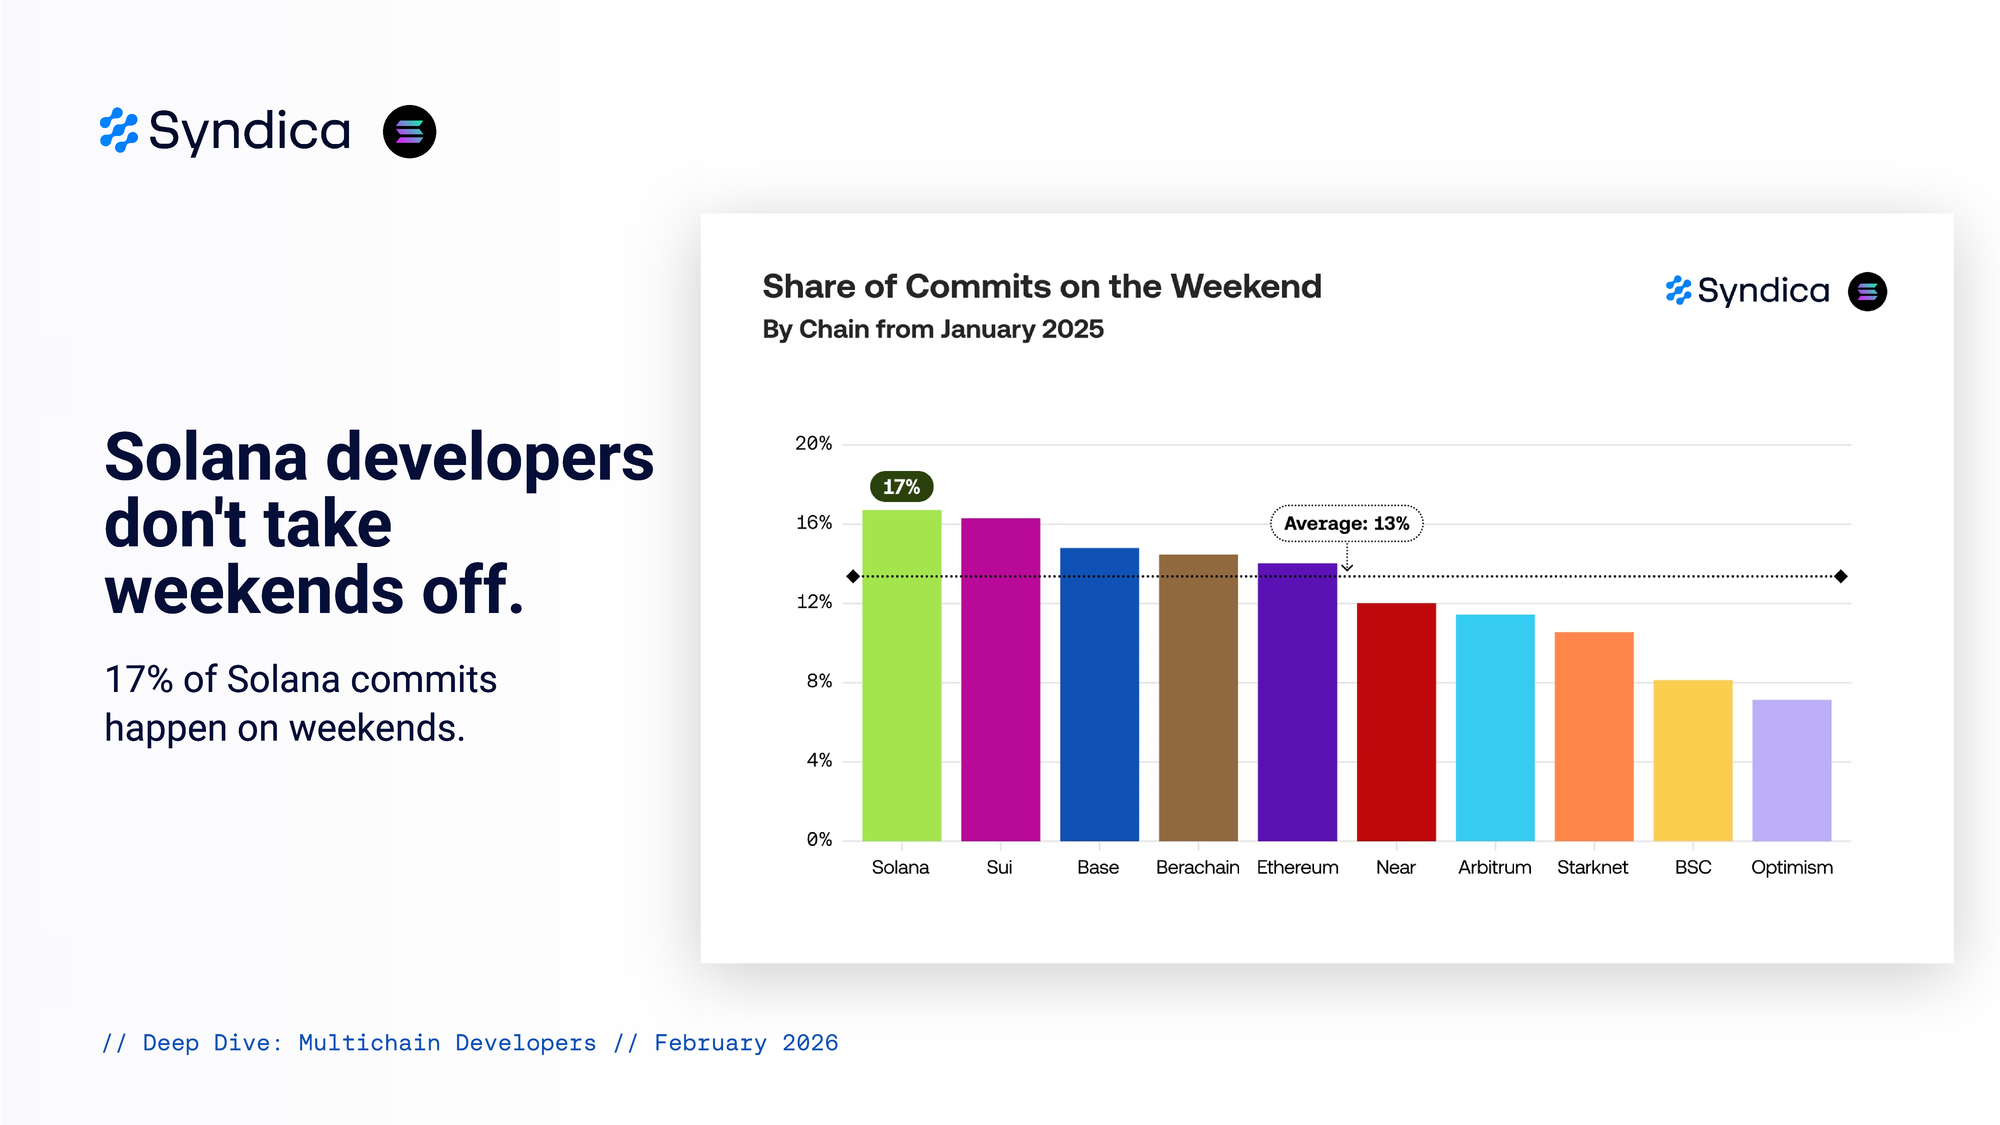
Solana developers don't take weekends off.
17% of Solana commits happen on weekends.
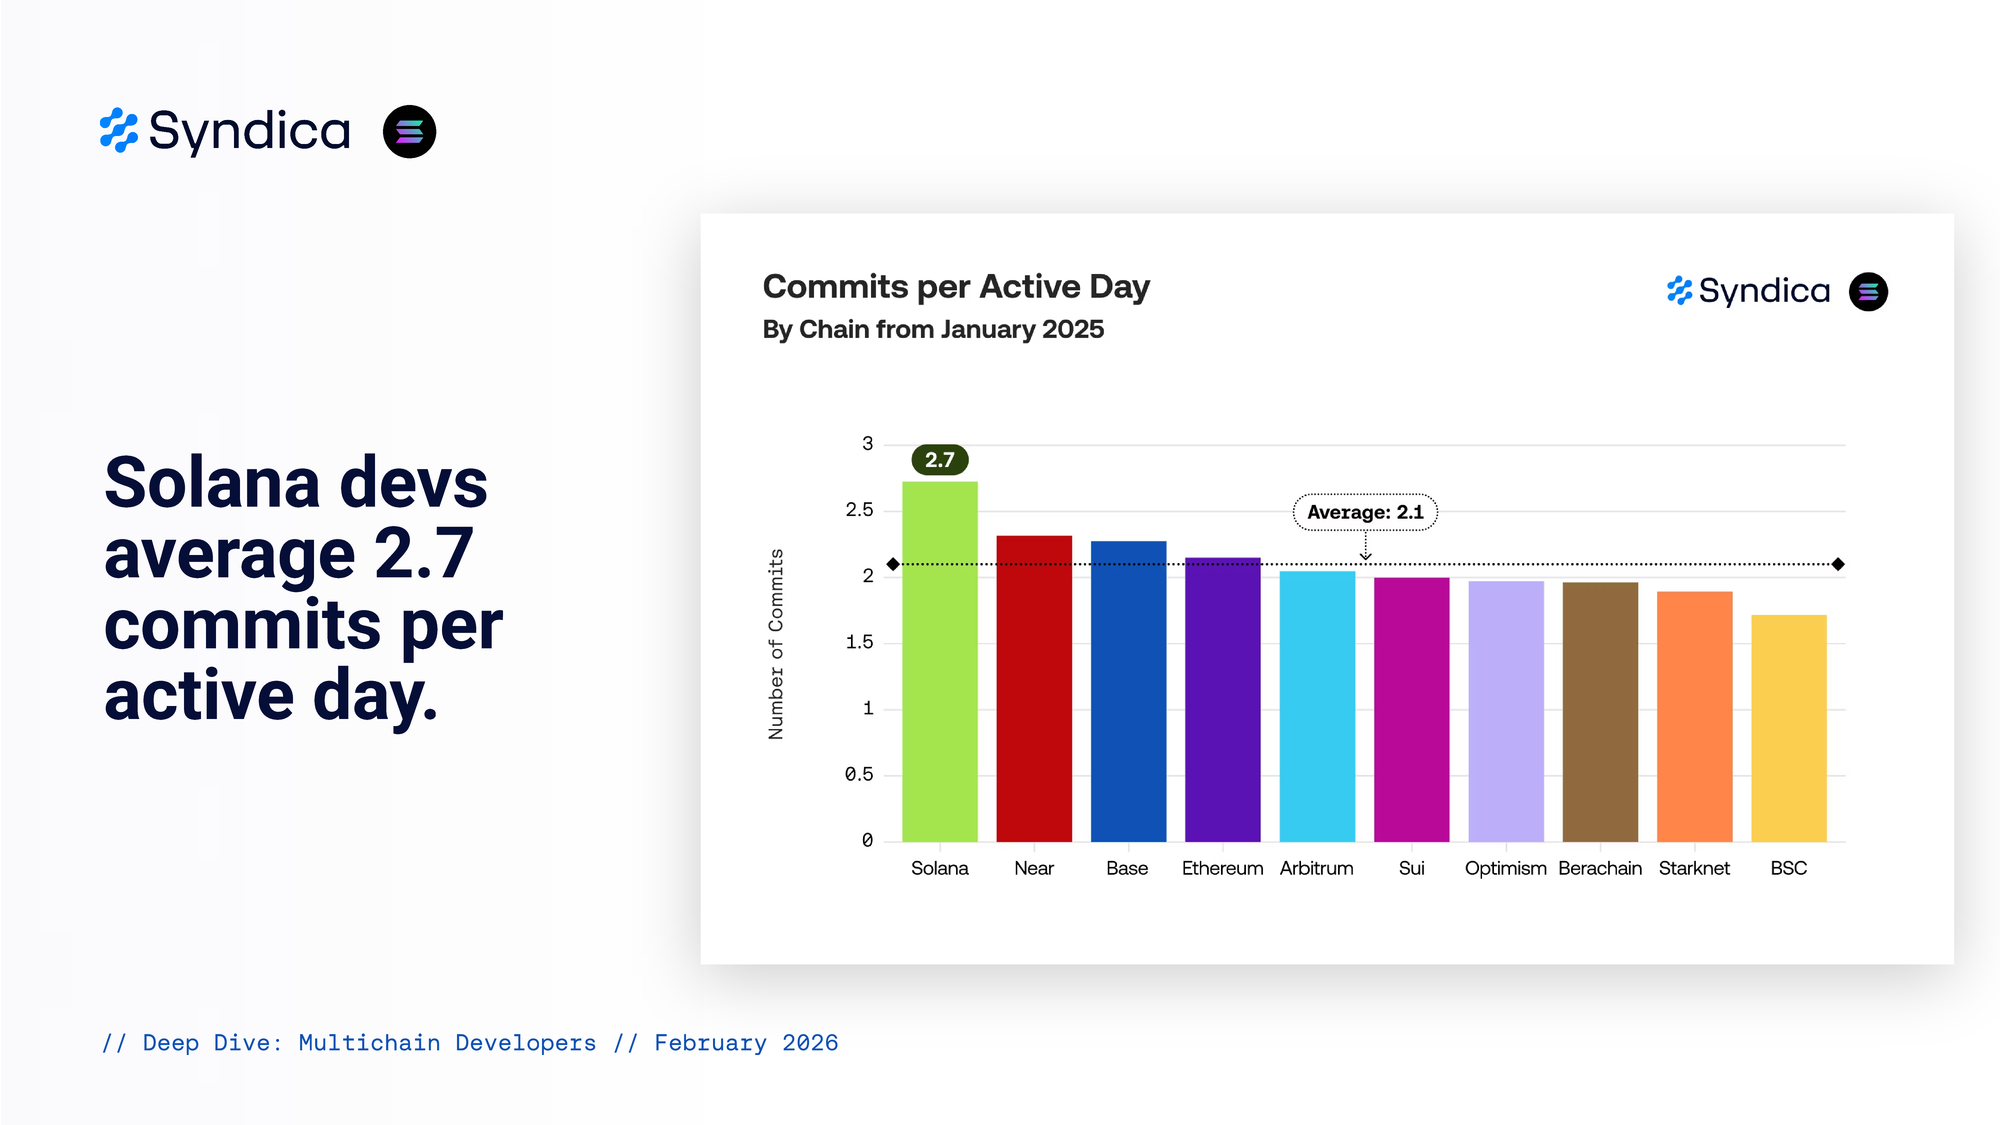
Solana devs average 2.7 commits per active day.
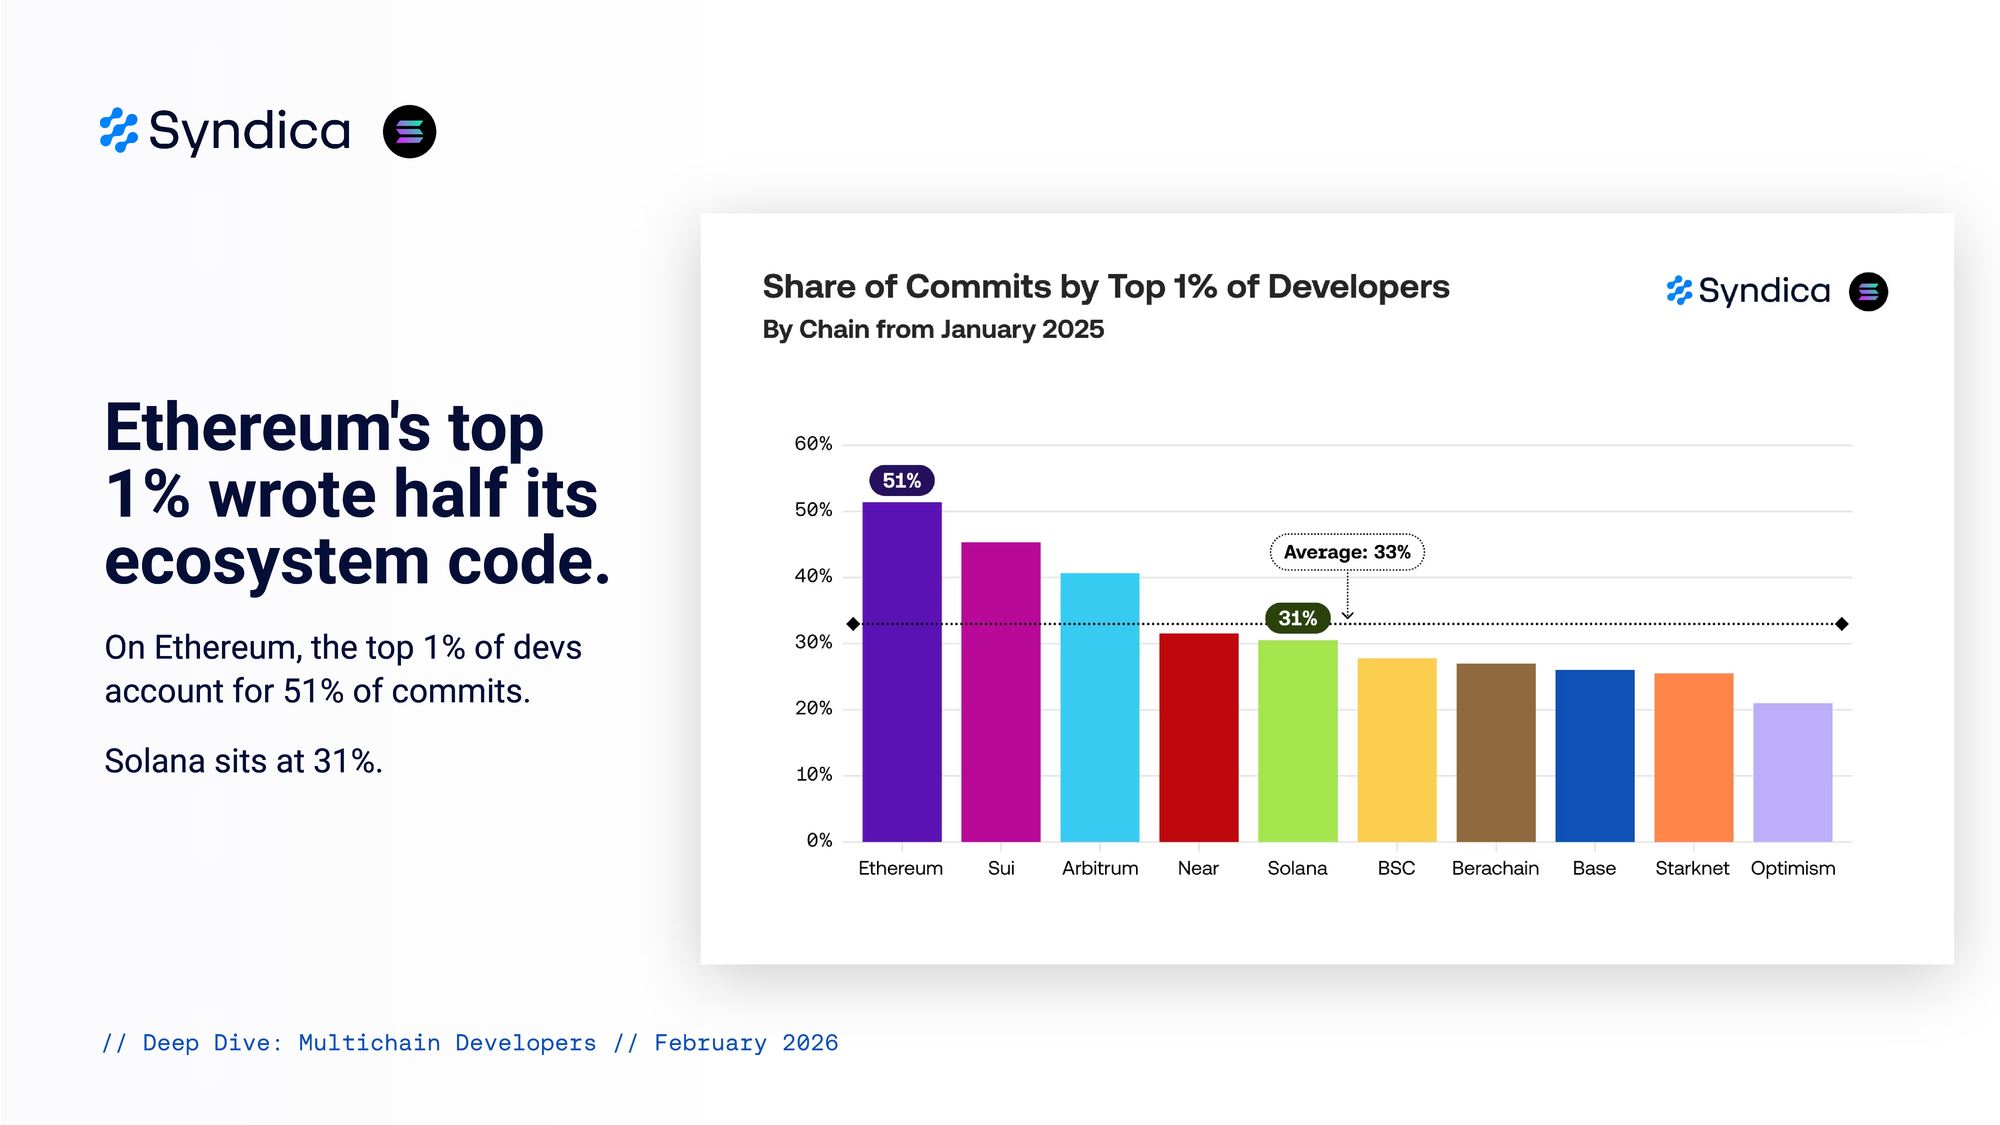
Ethereum's top 1% wrote half its ecosystem code.
On Ethereum, the top 1% of devs account for 51% of commits. Solana sits at 31%.
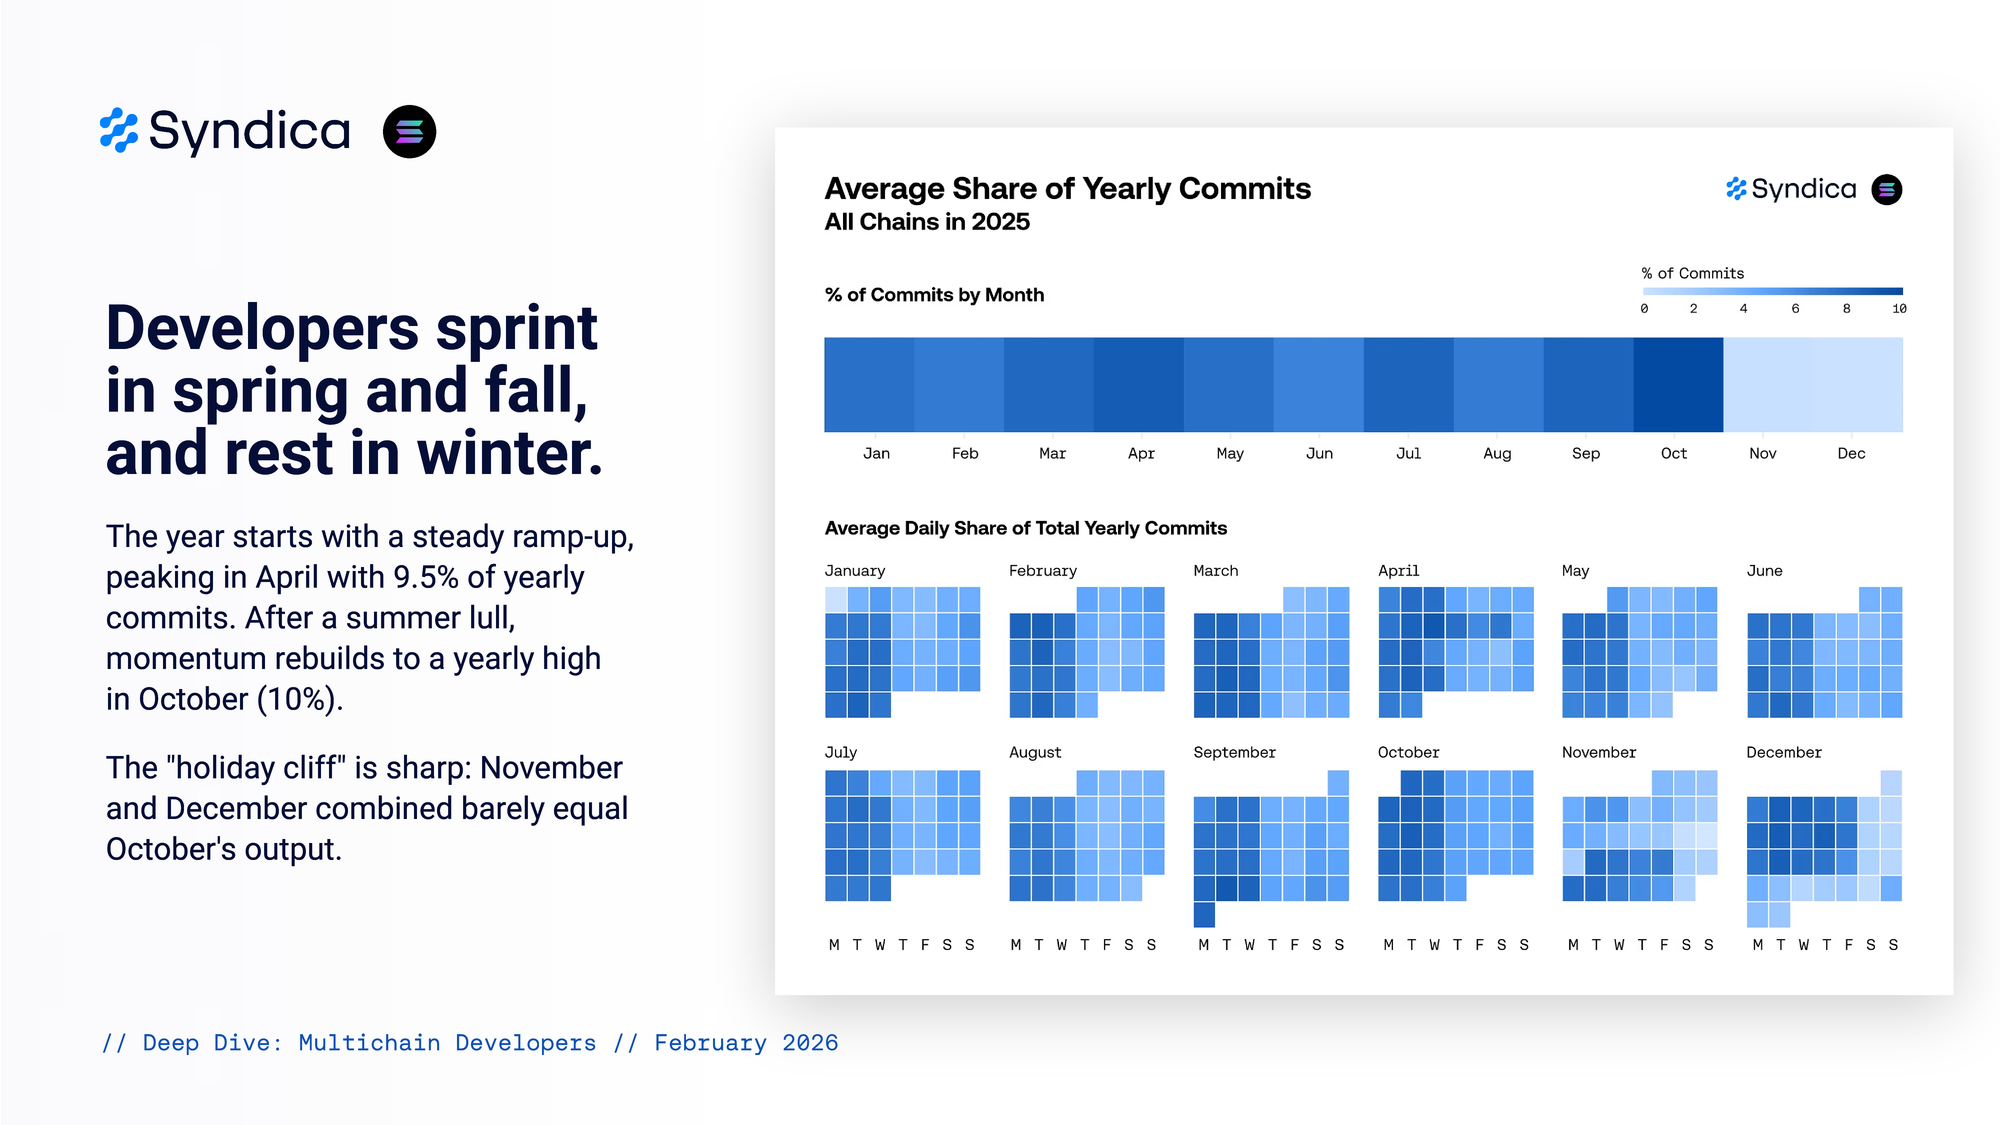
Developers sprint in spring and fall, and rest in winter.
The year starts with a steady ramp-up, peaking in April with 9.5% of yearly commits. After a summer lull, momentum rebuilds to a yearly high in October (10%). The "holiday cliff" is sharp: November and December combined barely equal October's output.
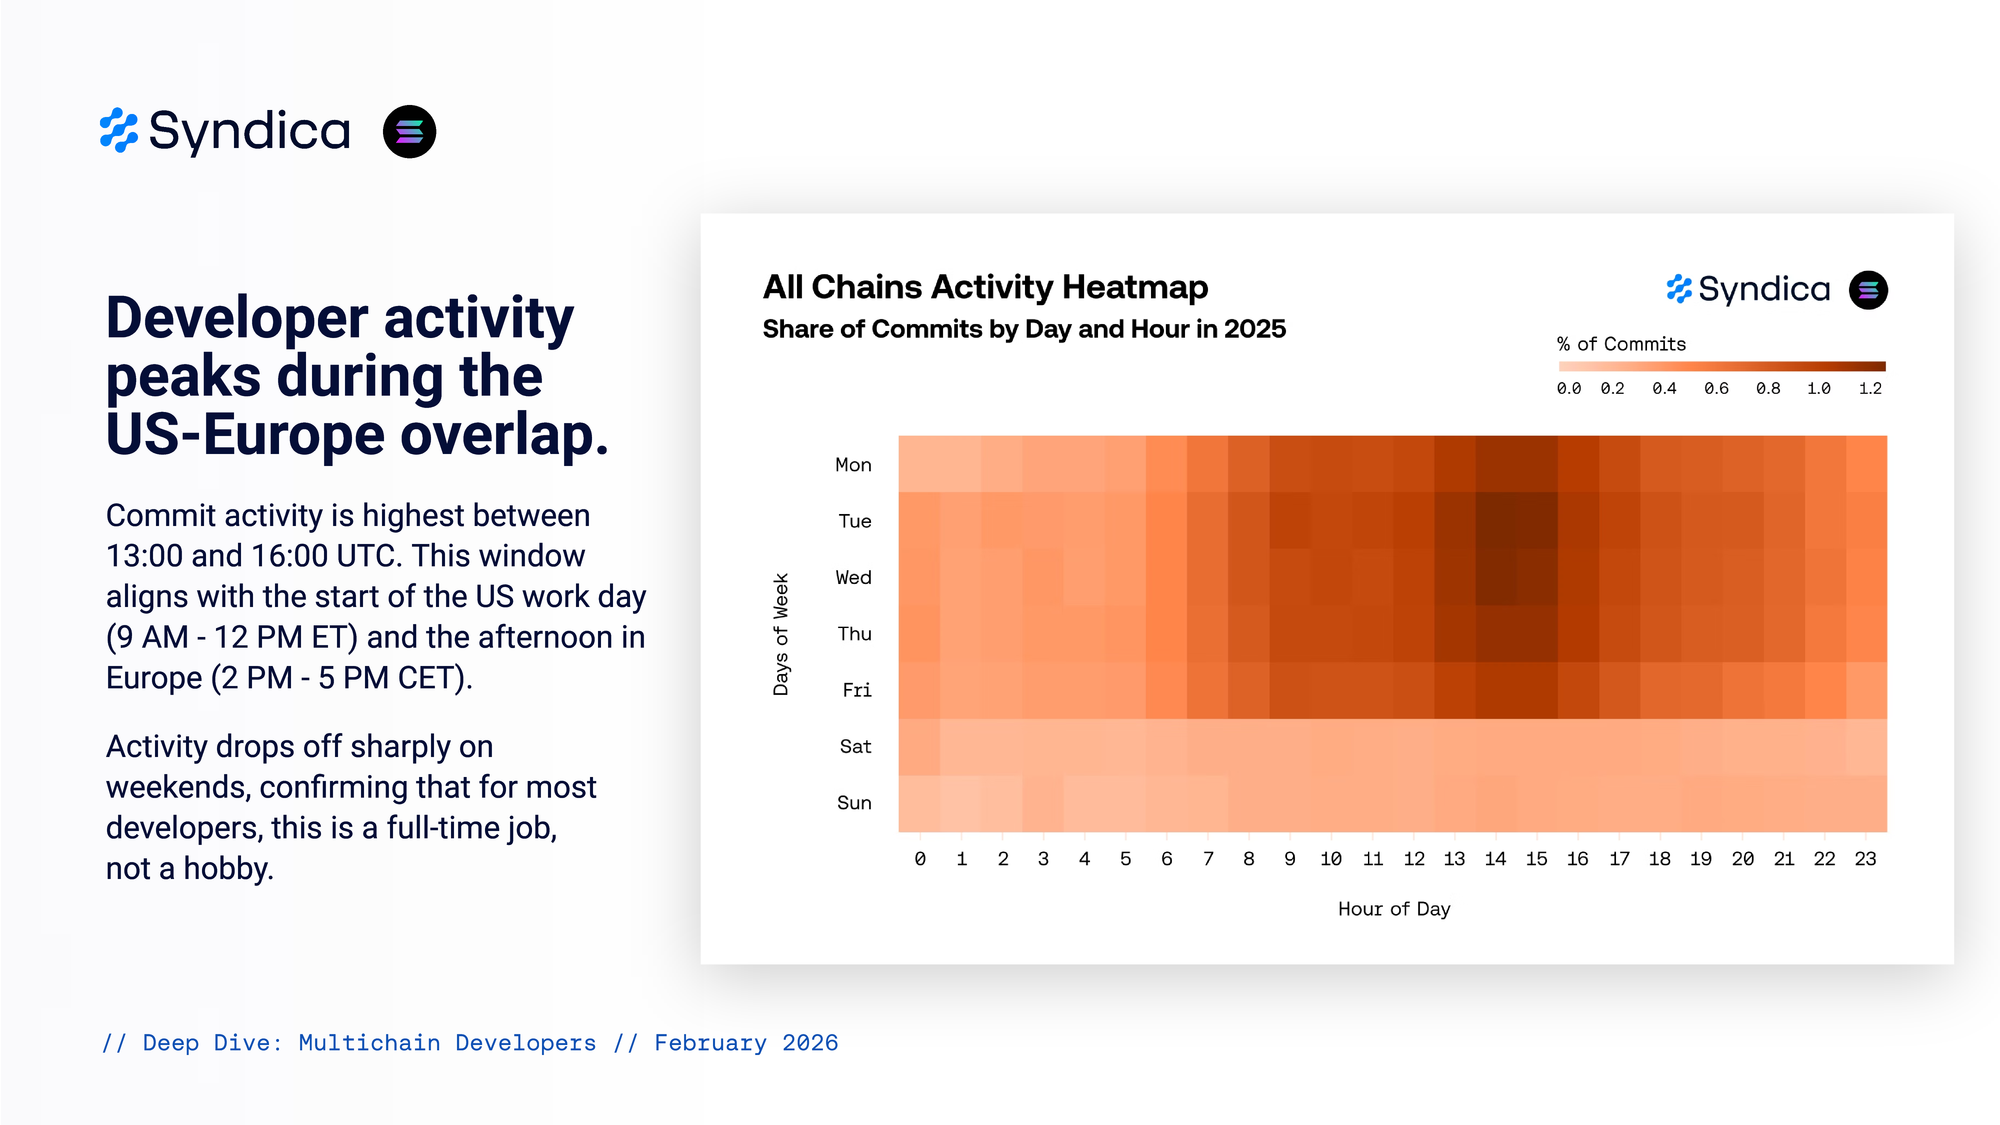
Developer activity peaks during the US-Europe overlap.
Commit activity is highest between 13:00 and 16:00 UTC. This window aligns with the start of the US work day (9 AM - 12 PM ET) and the afternoon in Europe (2 PM - 5 PM CET). Activity drops off sharply on weekends, confirming that for most developers, this is a full-time job, not a hobby.
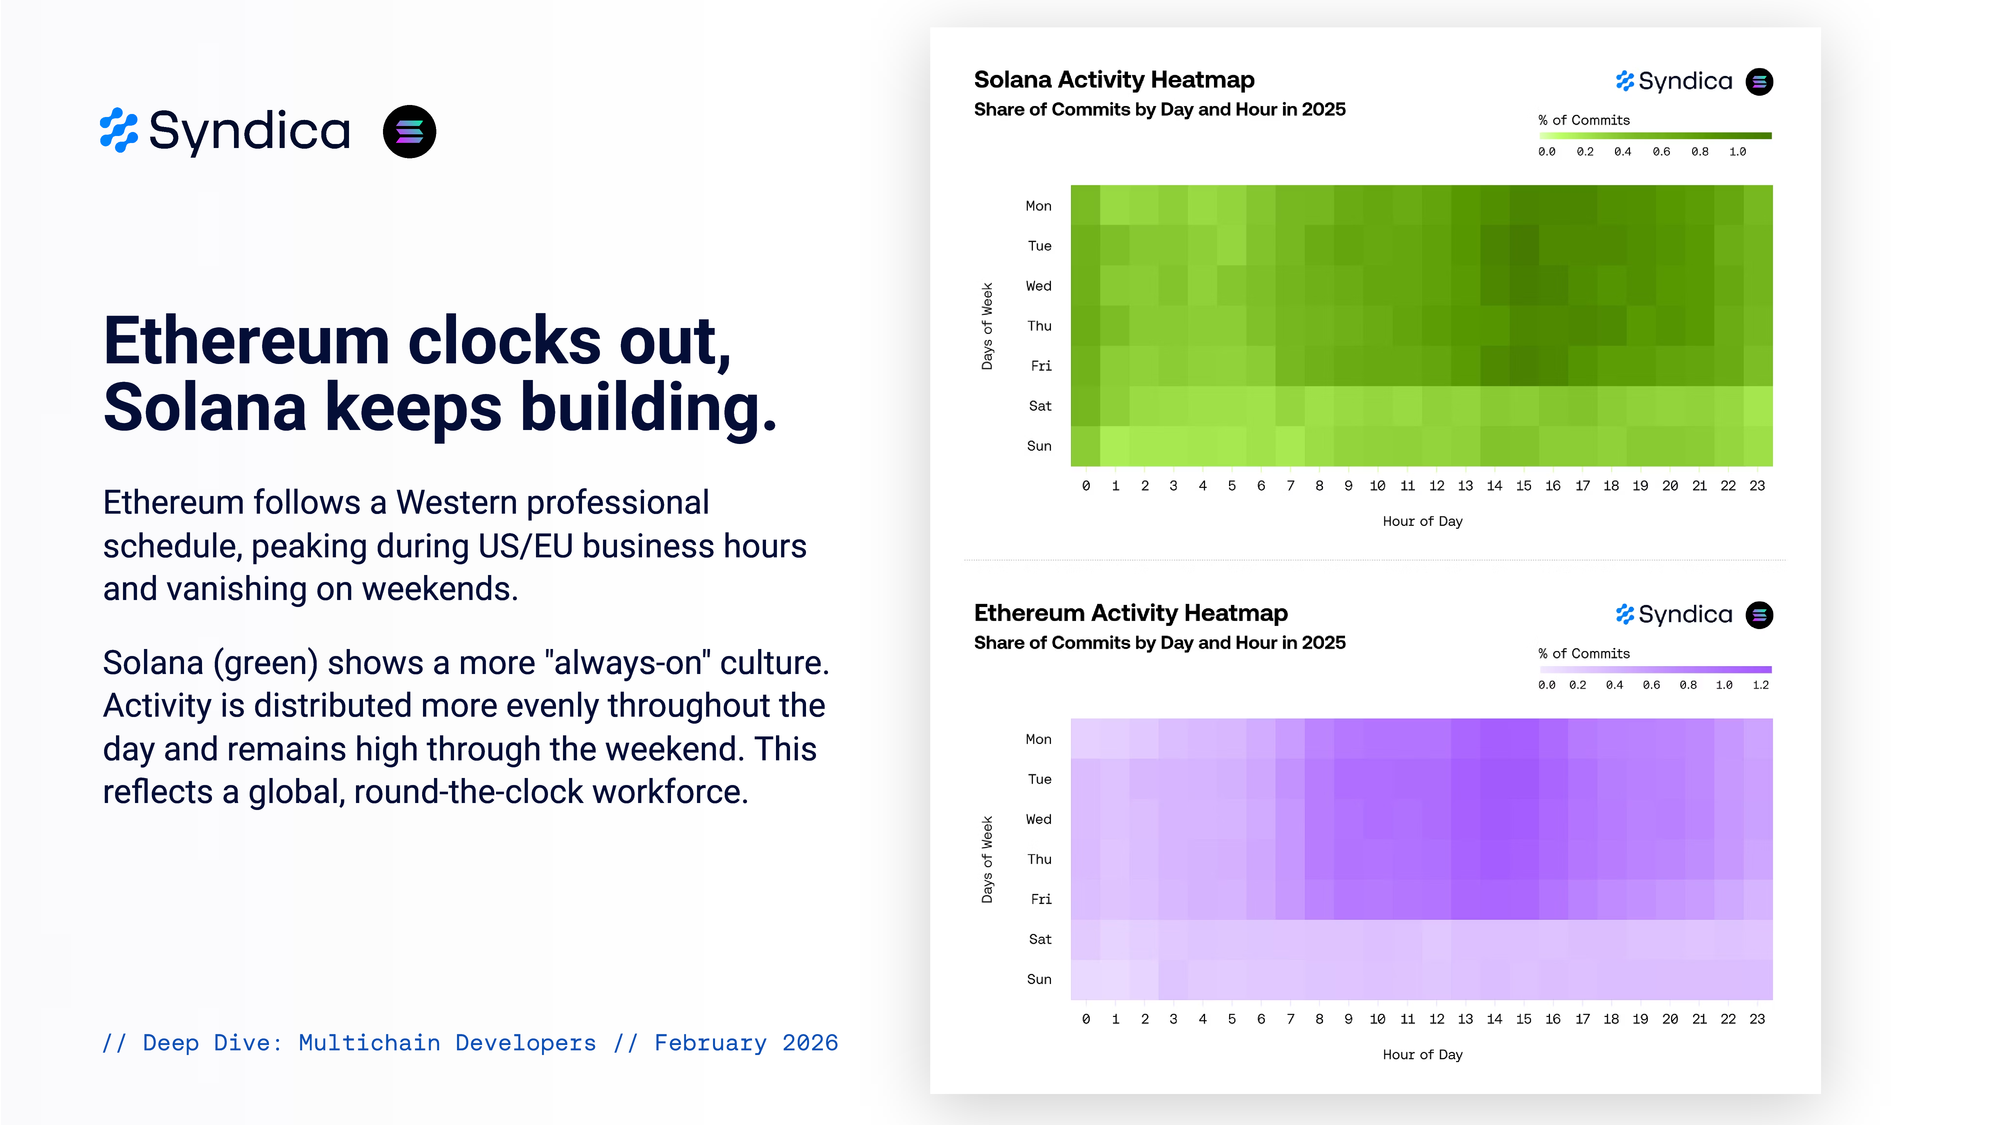
Ethereum clocks out, Solana keeps building.
Ethereum follows a Western professional schedule, peaking during US/EU business hours and vanishing on weekends. Solana (green) shows a more "always-on" culture. Activity is distributed more evenly throughout the day and remains high through the weekend. This reflects a global, round-the-clock workforce.
Part IV Geography
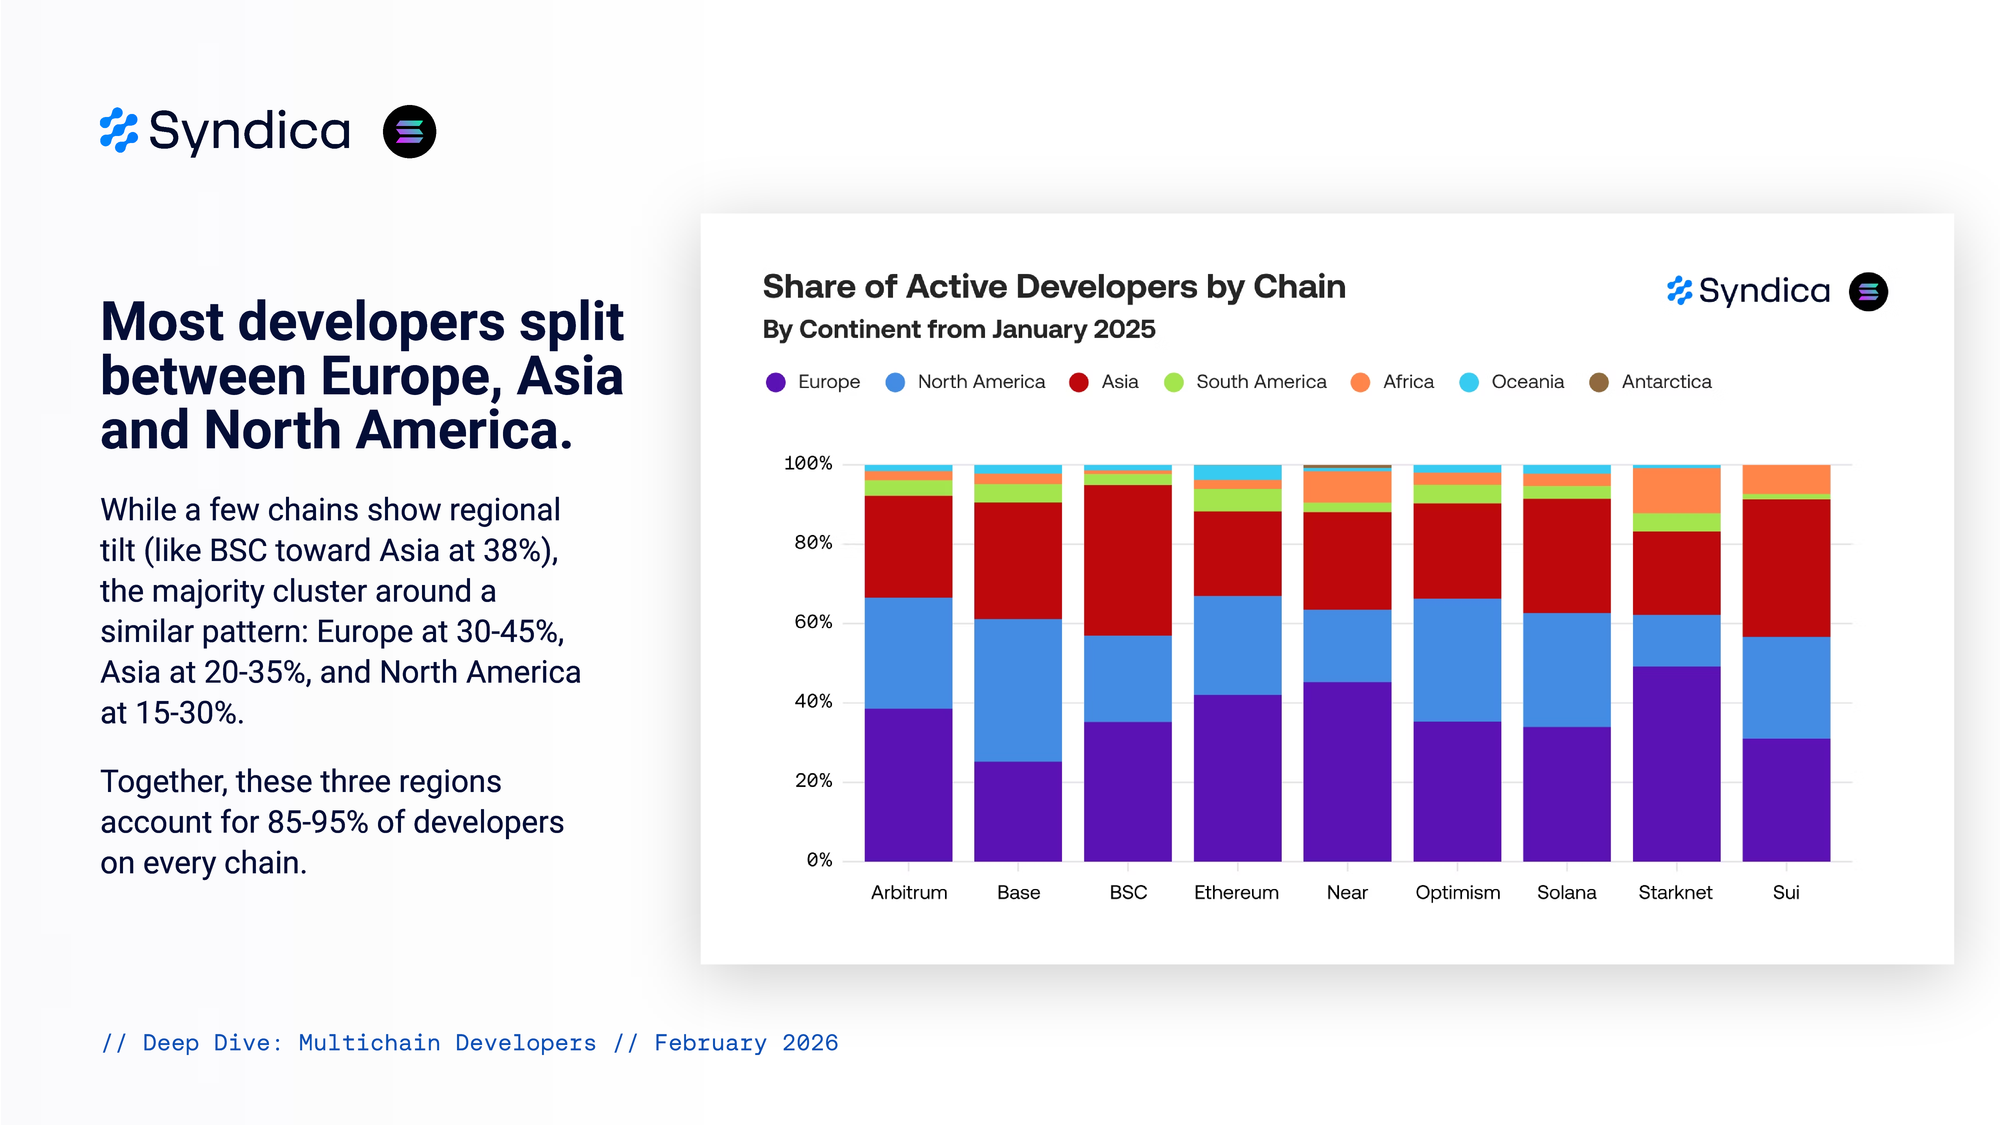
Most developers split between Europe, Asia and North America.
While a few chains show regional tilt (like BSC toward Asia at 38%), the majority cluster around a similar pattern: Europe at 30-45%, Asia at 20-35%, and North America at 15-30%. Together, these three regions account for 85-95% of developers on every chain.
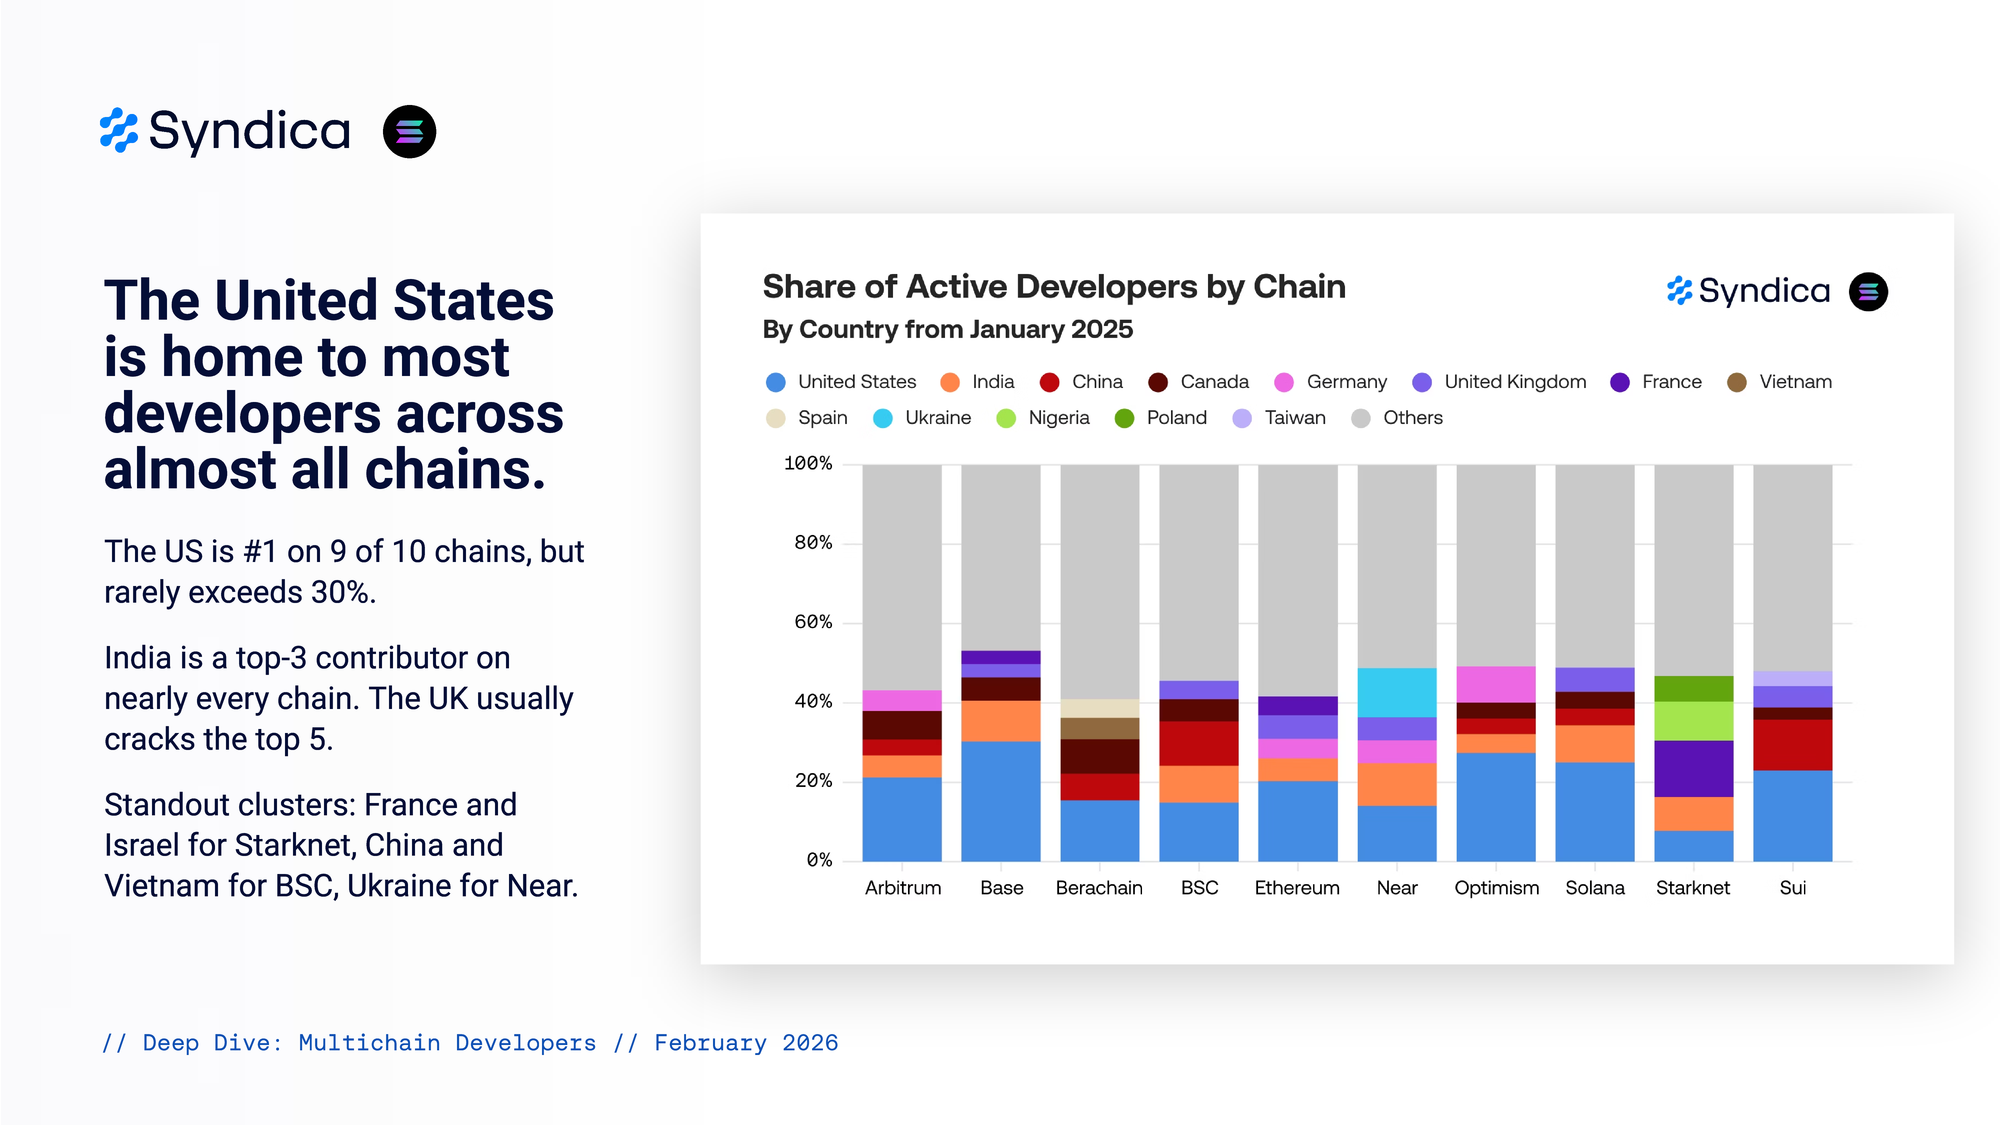
The United States is home to most developers across almost all chains.
The US is #1 on 9 of 10 chains, but rarely exceeds 30%. India is a top-3 contributor on nearly every chain. The UK usually cracks the top 5. Standout clusters: France and Israel for Starknet, China and Vietnam for BSC, Ukraine for Near.
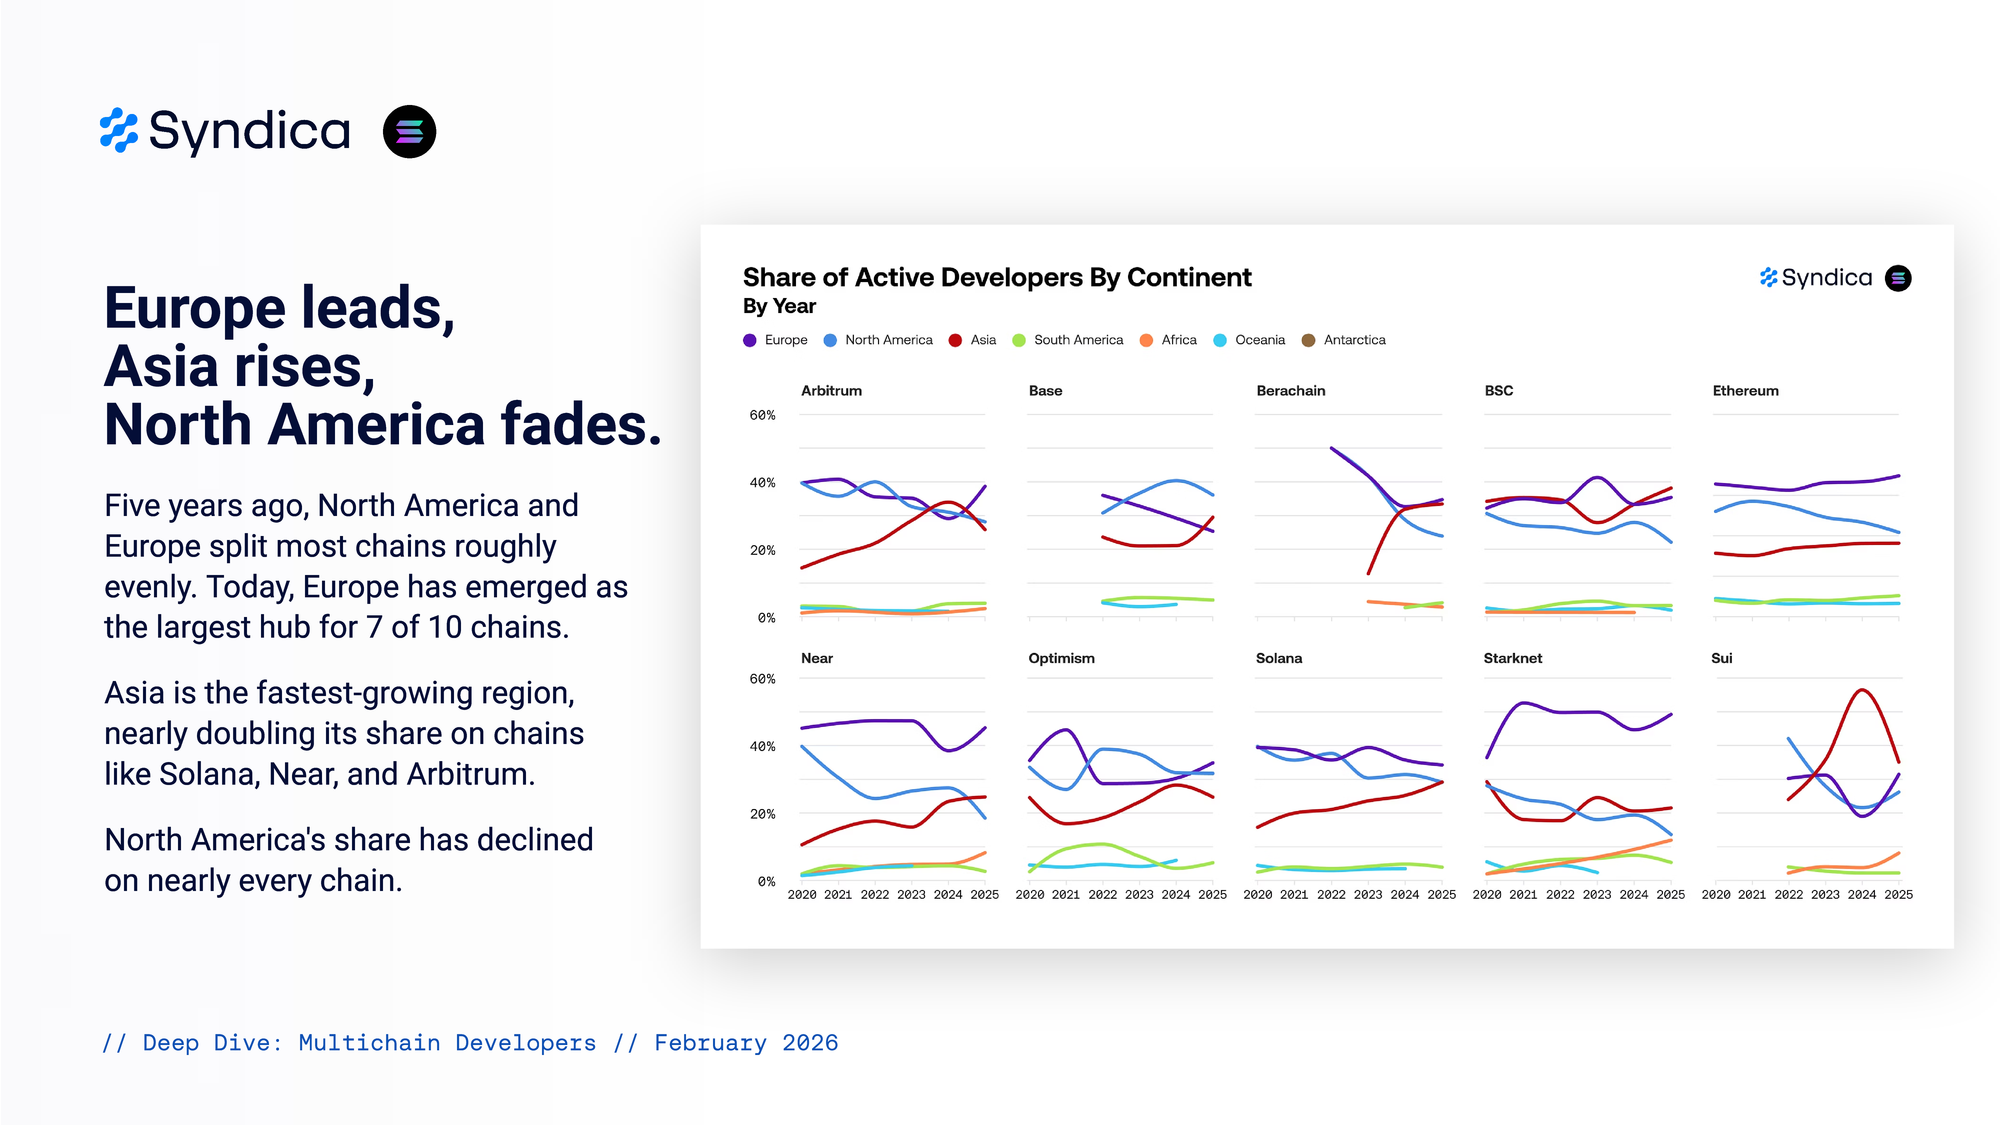
Europe leads, Asia rises, North America fades.
Five years ago, North America and Europe split most chains roughly evenly. Today, Europe has emerged as the largest hub for 7 of 10 chains. Asia is the fastest-growing region, nearly doubling its share on chains like Solana, Near, and Arbitrum. North America's share has declined on nearly every chain.
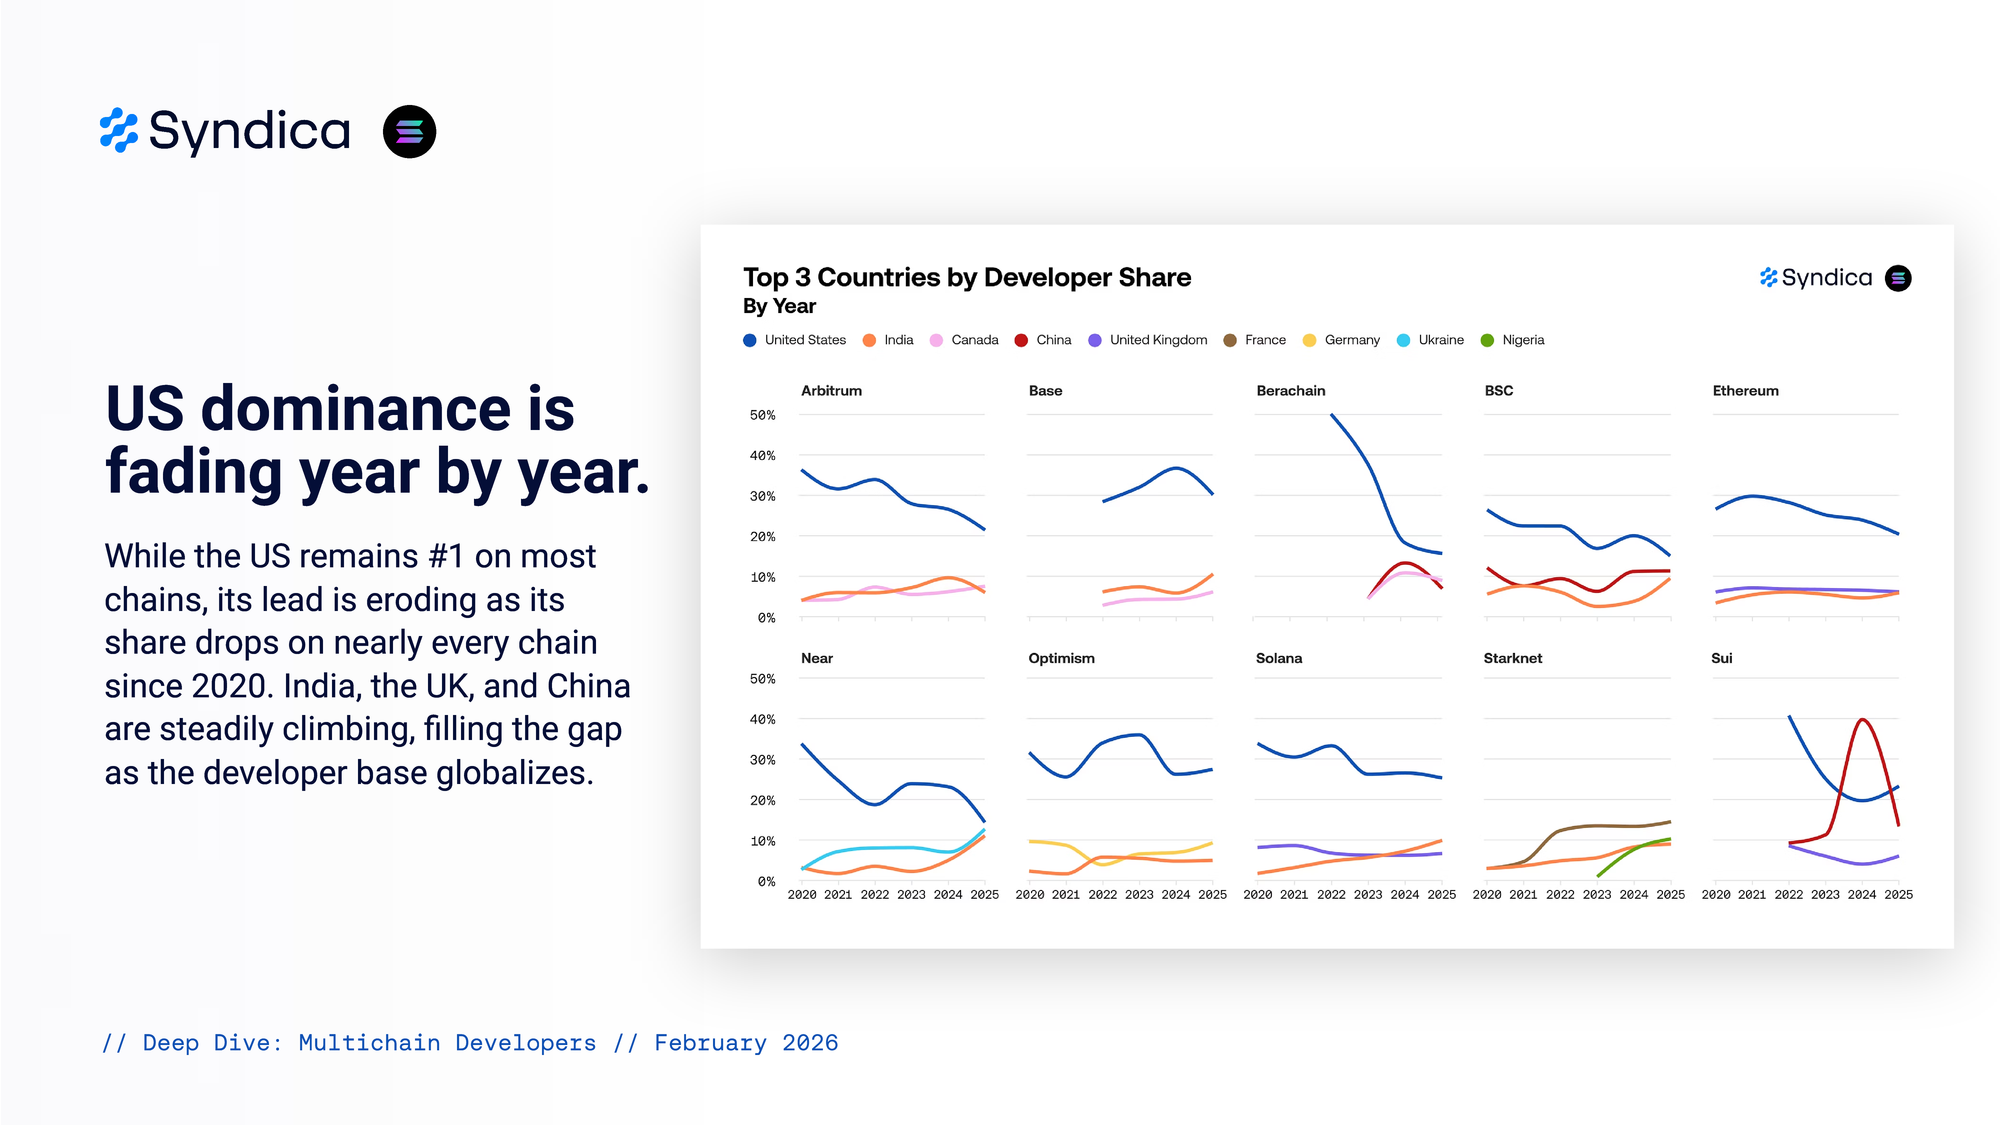
US dominance is fading year by year.
While the US remains #1 on most chains, its lead is eroding as its share drops on nearly every chain since 2020. India, the UK, and China are steadily climbing, filling the gap as the developer base globalizes.