Deep Dive: Solana Developers - December 2025
Deep Dive: Solana Developers - December 2025
Note: Below is the text-accessible version of this post for visually impaired readers.
Syndica Deep Dive: Solana Developers - December 2025
How did we create our developer data database?
We built our database by scanning GitHub for crypto-related open-source activity across various blockchains, using a crawler to analyze key files like package.json and Cargo.toml, and incorporating contributions from entities like Solana Labs and Jito.
We gathered repository data, extracted commits, PRs and reviews from all branches and tags, and compiled a list of contributing developers, collecting their data as well. We also filter GitHub activity from organizations and repositories that are primarily multichain or do not clearly belong to a specific chain. For example, we drop AI-related projects that do not belong to a chain specifically (we keep Virtuals for Base, but do not include Eliza OS).
We cleaned the data by filtering out low-value activity—think inactive forks, empty projects, or those with minimal commits, bot-generated activity, etc. Our focus was on repositories and code that live on-chain or support its infrastructure, including clients, smart contracts, and RPCs, while excluding code related to projects like Dune or DeFiLlama that serve crypto but are more peripheral.
In this report, we will focus on Solana.
This report only contains data until December 31st, 2025.
Developer Classification Methodology
We classify developers into two categories—Professional and Hobbyist—based on their activity patterns using a decision tree classifier. Our model analyzes three key aspects of developer behavior:
Activity: Volume of recent work (commits, lines of code, pull requests, reviews)
Depth: Breadth of contributions across repositories, ecosystems, and programming languages
Tenure: Consistency of engagement over time
We trained the model using an active learning process, where the algorithm identifies the most informative cases to label next. After training the model, we use it to classify developers across chains on a monthly basis.
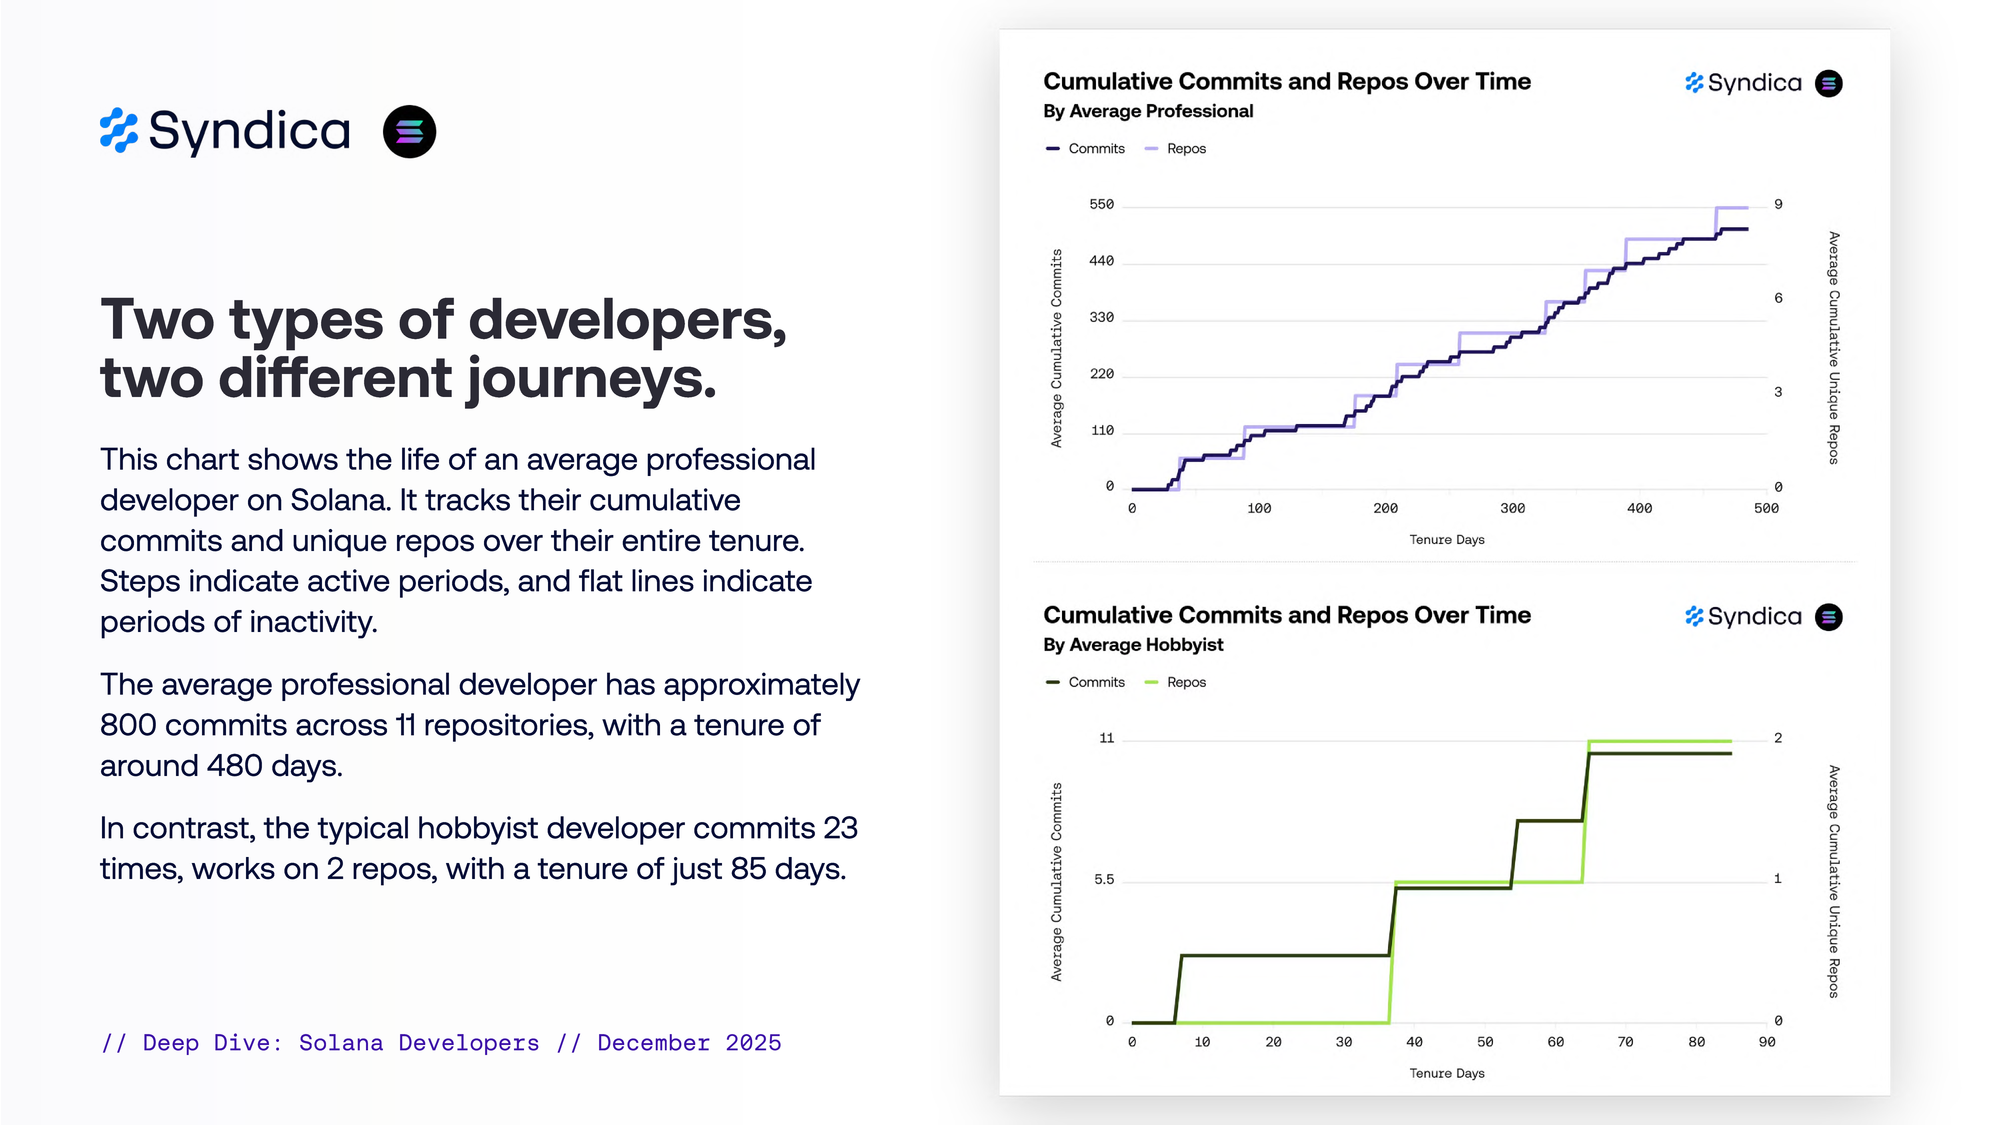
Two types of developers, two different journeys.
This chart shows the life of an average professional developer on Solana. It tracks their cumulative commits and unique repos over their entire tenure. Steps indicate active periods, and flat lines indicate periods of inactivity.
The average professional developer has approximately 800 commits across 11 repositories, with a tenure of around 550 days.
In contrast, the typical hobbyist developer commits 23 times, works on three repos, with a tenure of just 50 days.
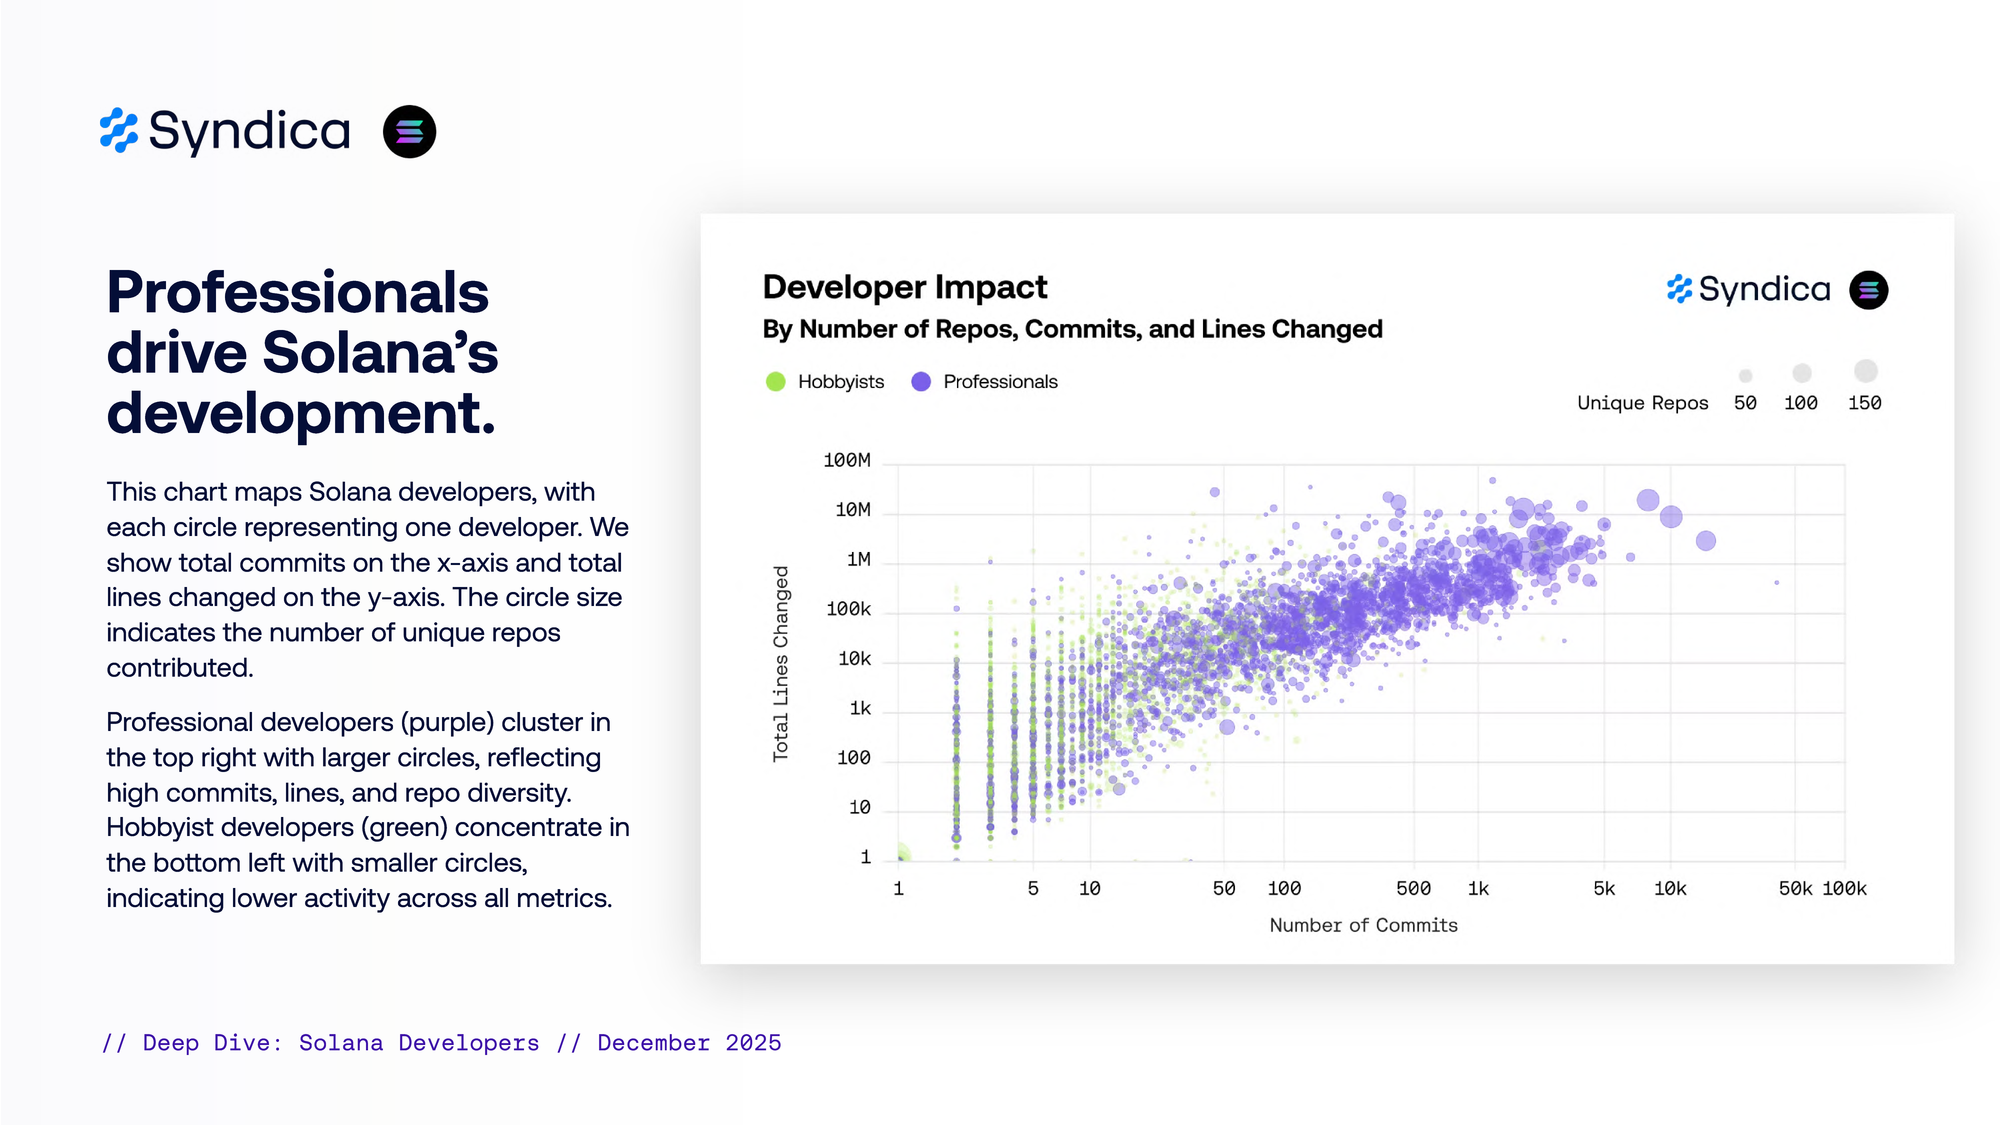
Professionals drive Solana’s development.
This chart maps Solana developers, with each circle representing one developer. We show total commits on the x-axis and total lines changed on the y-axis. The circle size indicates the number of unique repos contributed.
Professional developers (purple) cluster in the top right with larger circles, reflecting high commits, lines, and repo diversity. Hobbyist developers (green) concentrate in the bottom left with smaller circles, indicating lower activity across all metrics.
Part I
Activity
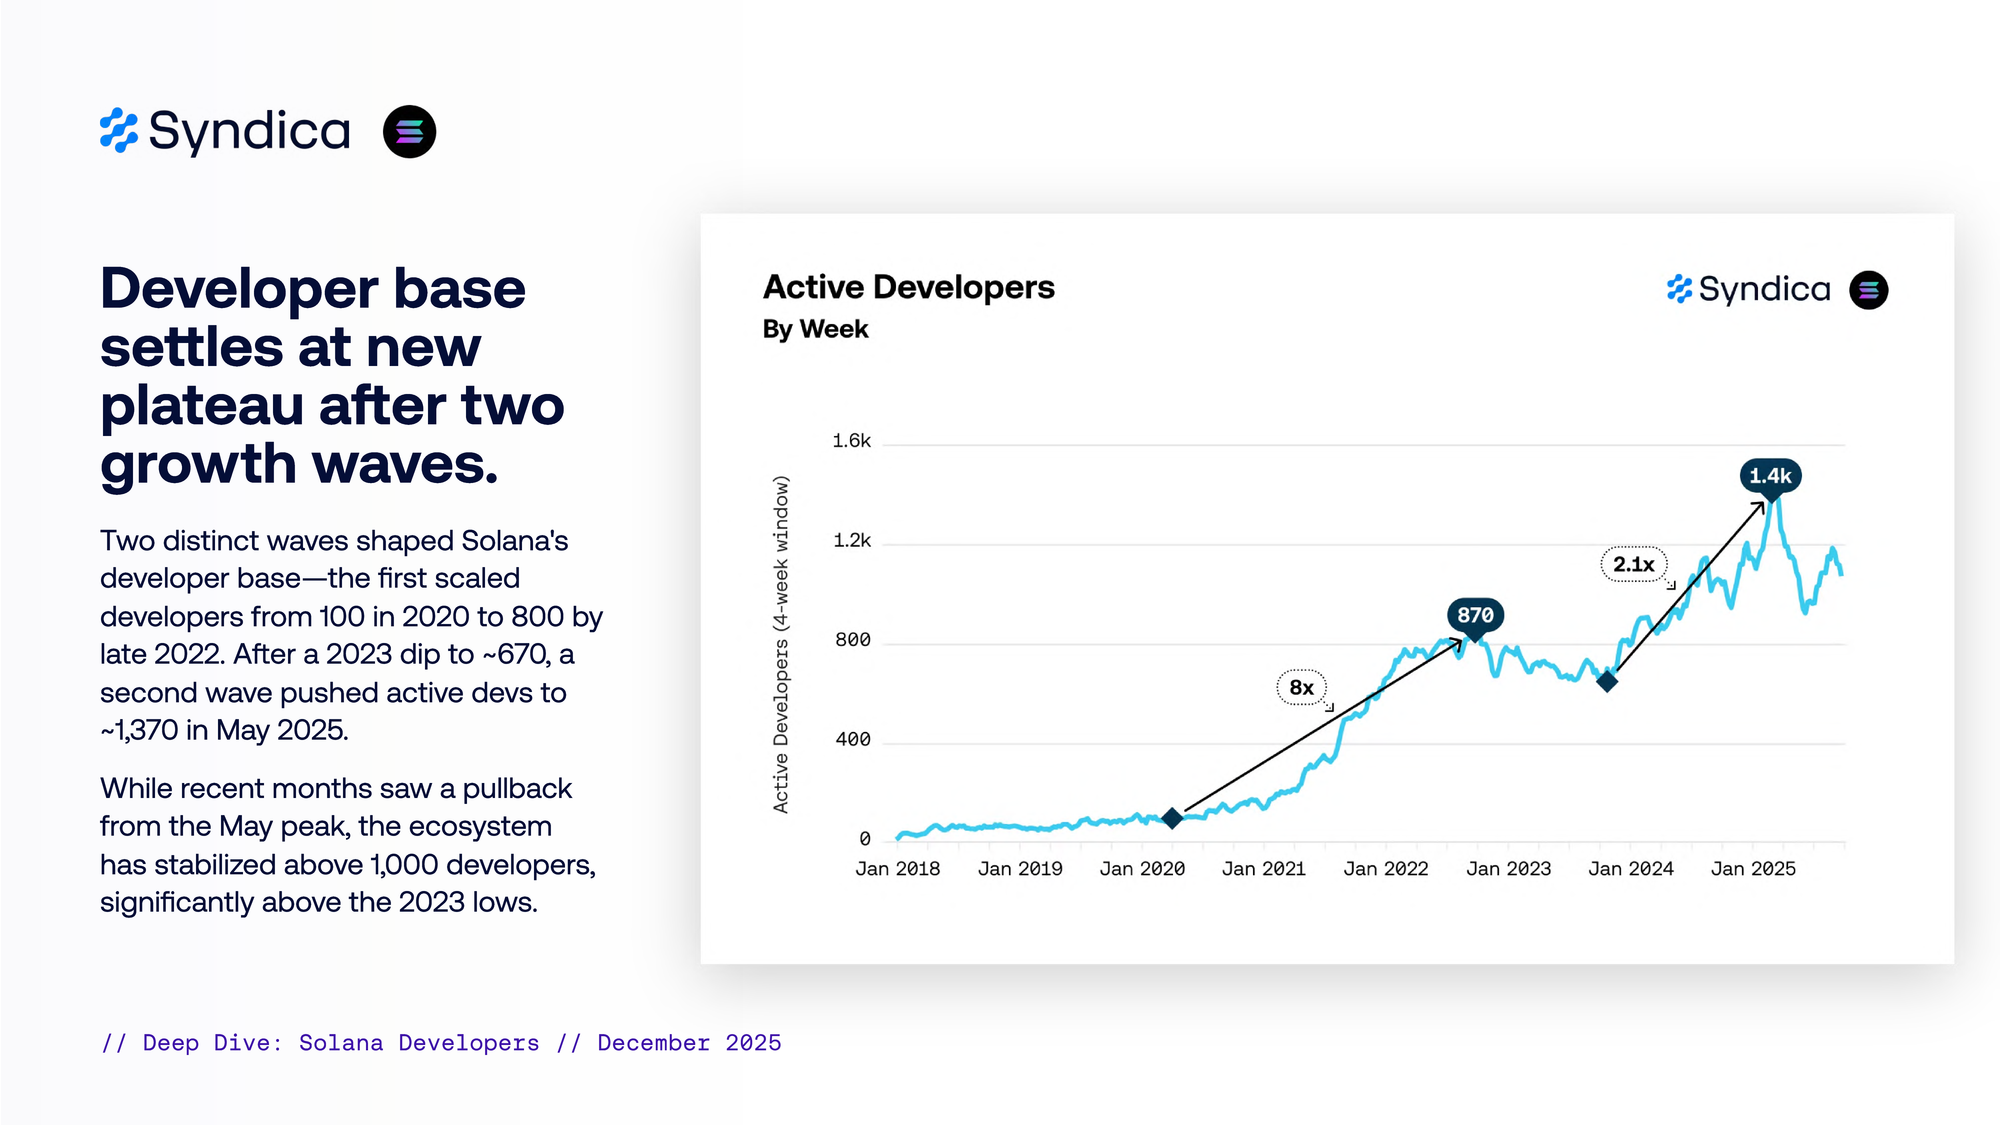
Developer base settles at new plateau after two growth waves.
Two distinct waves shaped Solana’s developer base—the first scaled developers from 100 in 2020 to 800 by late 2022. After a 2023 dip to ~670, a second wave pushed active devs to ~1,370 in May 2025.
While recent months saw a pullback from the May peak, the ecosystem has stabilized above 1,000 developers, significantly above the 2023 lows.
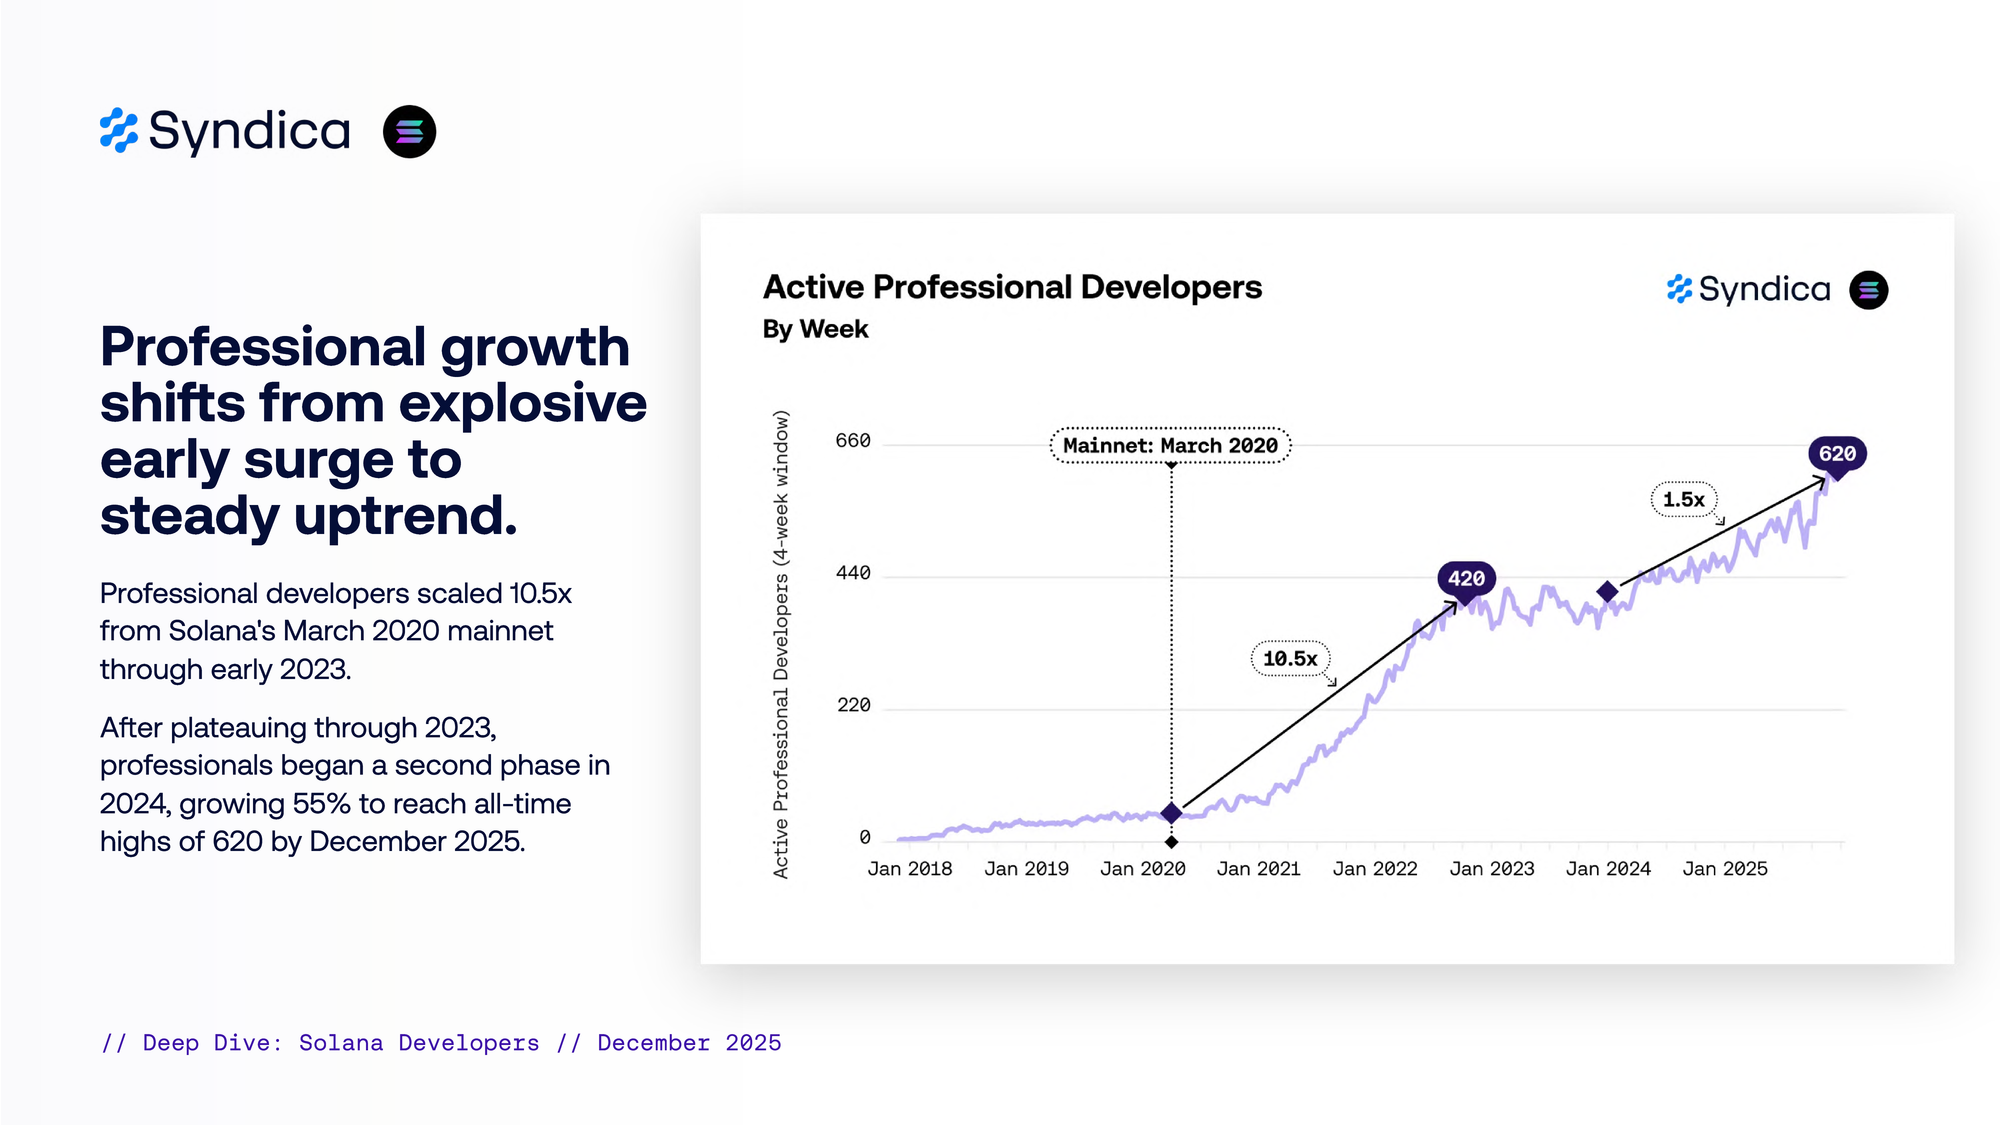
Professional growth shifts from explosive early surge to steady uptrend.
Professional developers scaled 10.5x from Solana’s March 2020 mainnet through early 2023.
After plateauing through 2023, professionals began a second phase in 2024, growing 55% to reach all-time highs of 620 by December 2025.
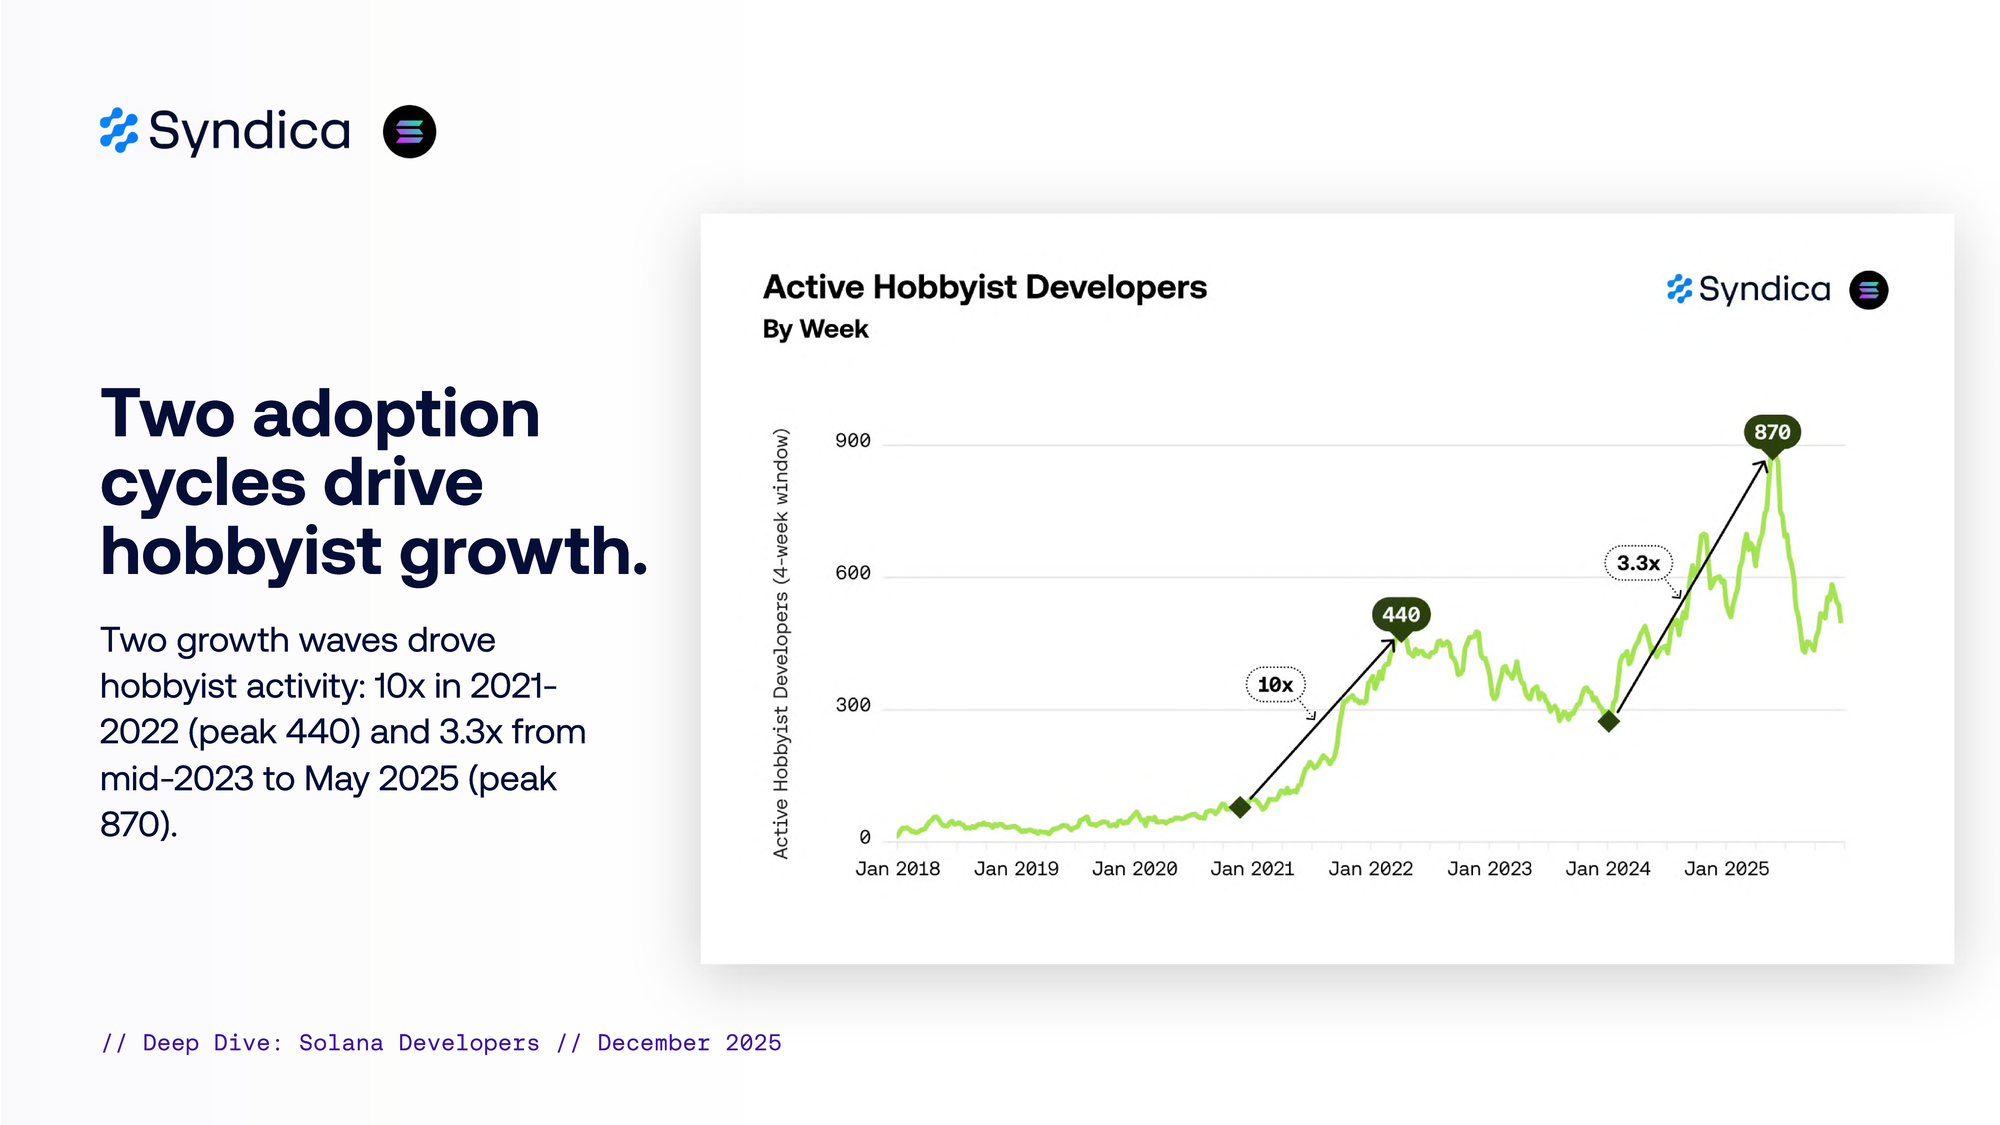
Two adoption cycles drive hobbyist growth.
Two growth waves drove hobbyist activity: 10x in 2021-2022 (peak 440) and 3.3x from mid-2023 to May 2025 (peak 870).
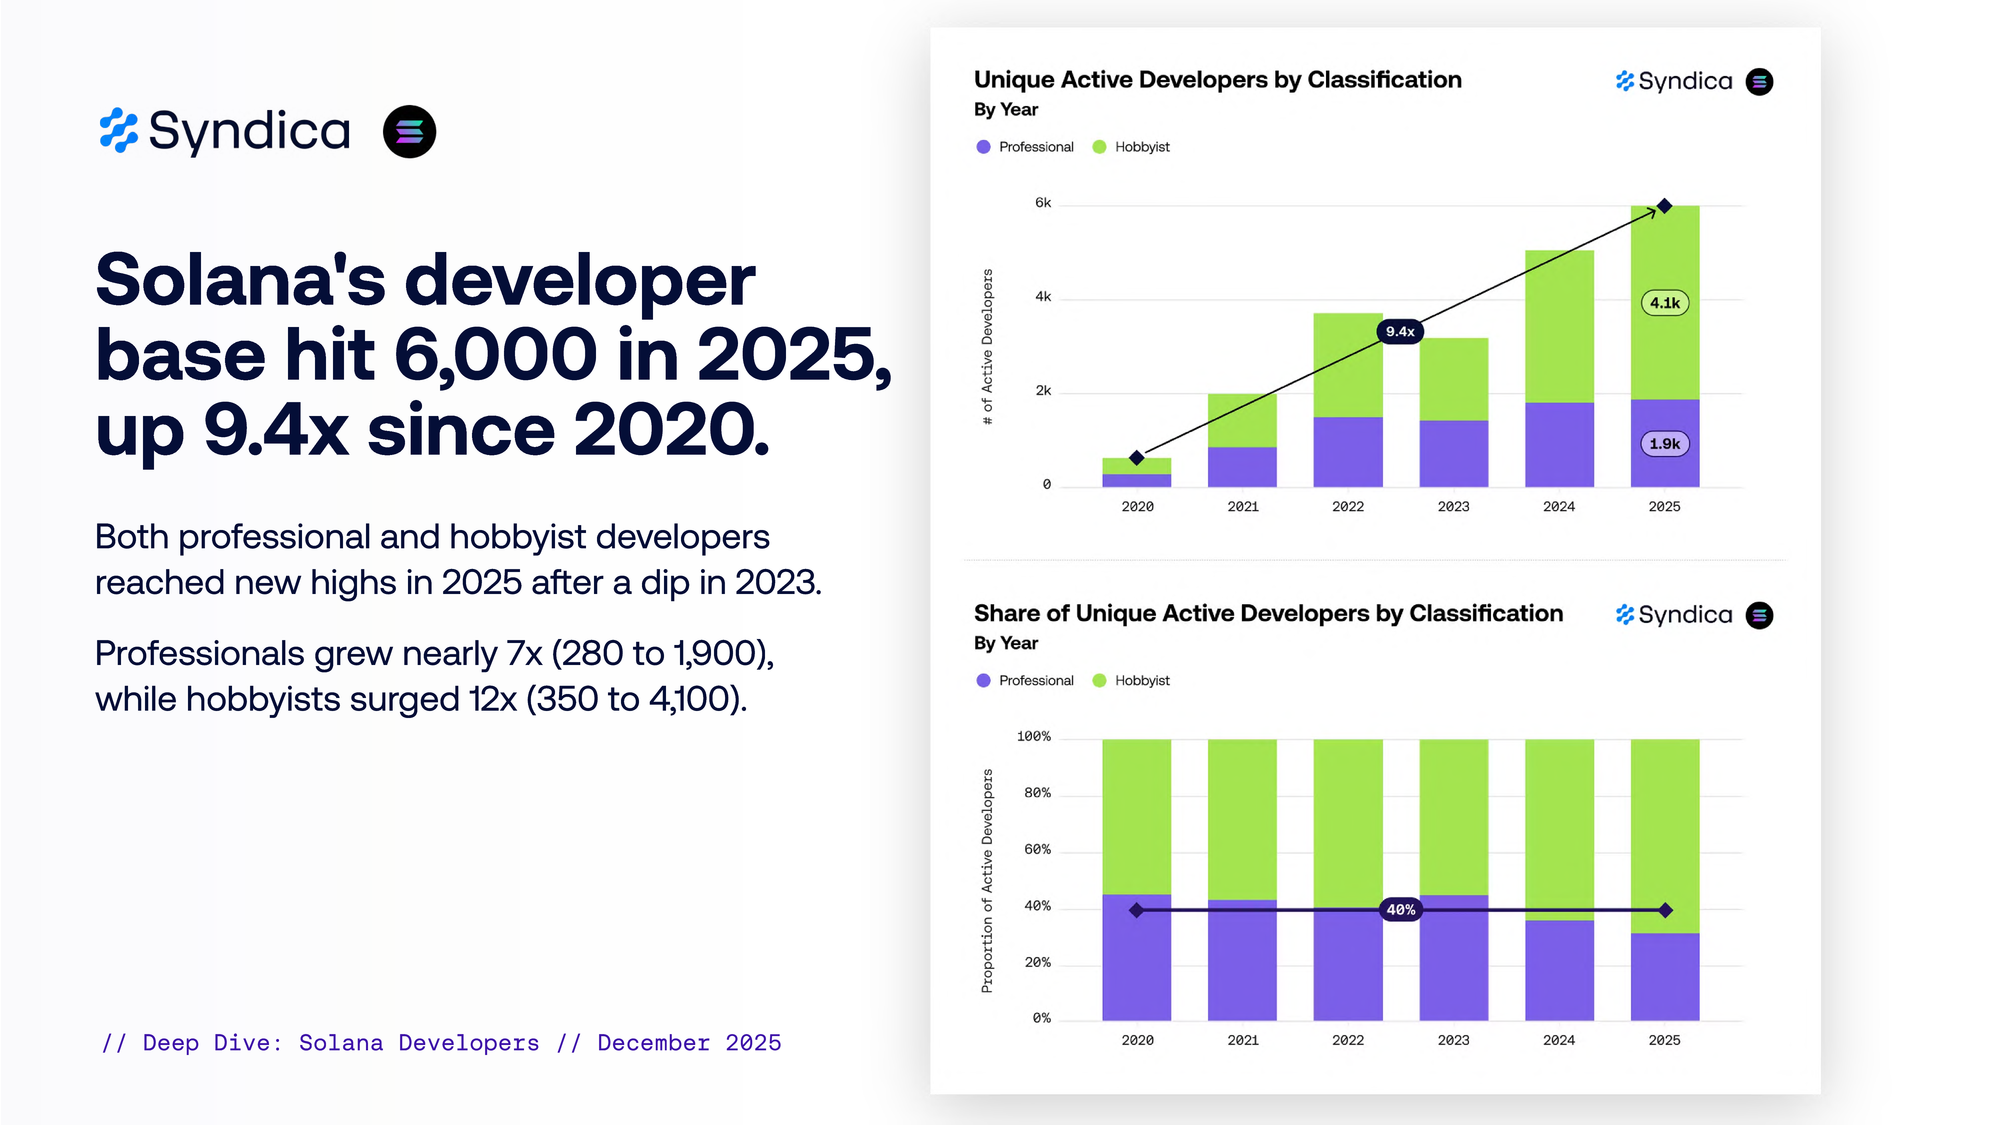
Solana’s developer base hit 6,000 in 2025, up 9.5x since 2020.
Both professional and hobbyist developers reached new highs in 2025 after a dip in 2023. Professionals grew nearly 7x (280 to 1,900), while hobbyists surged 12x (350 to 4,100).
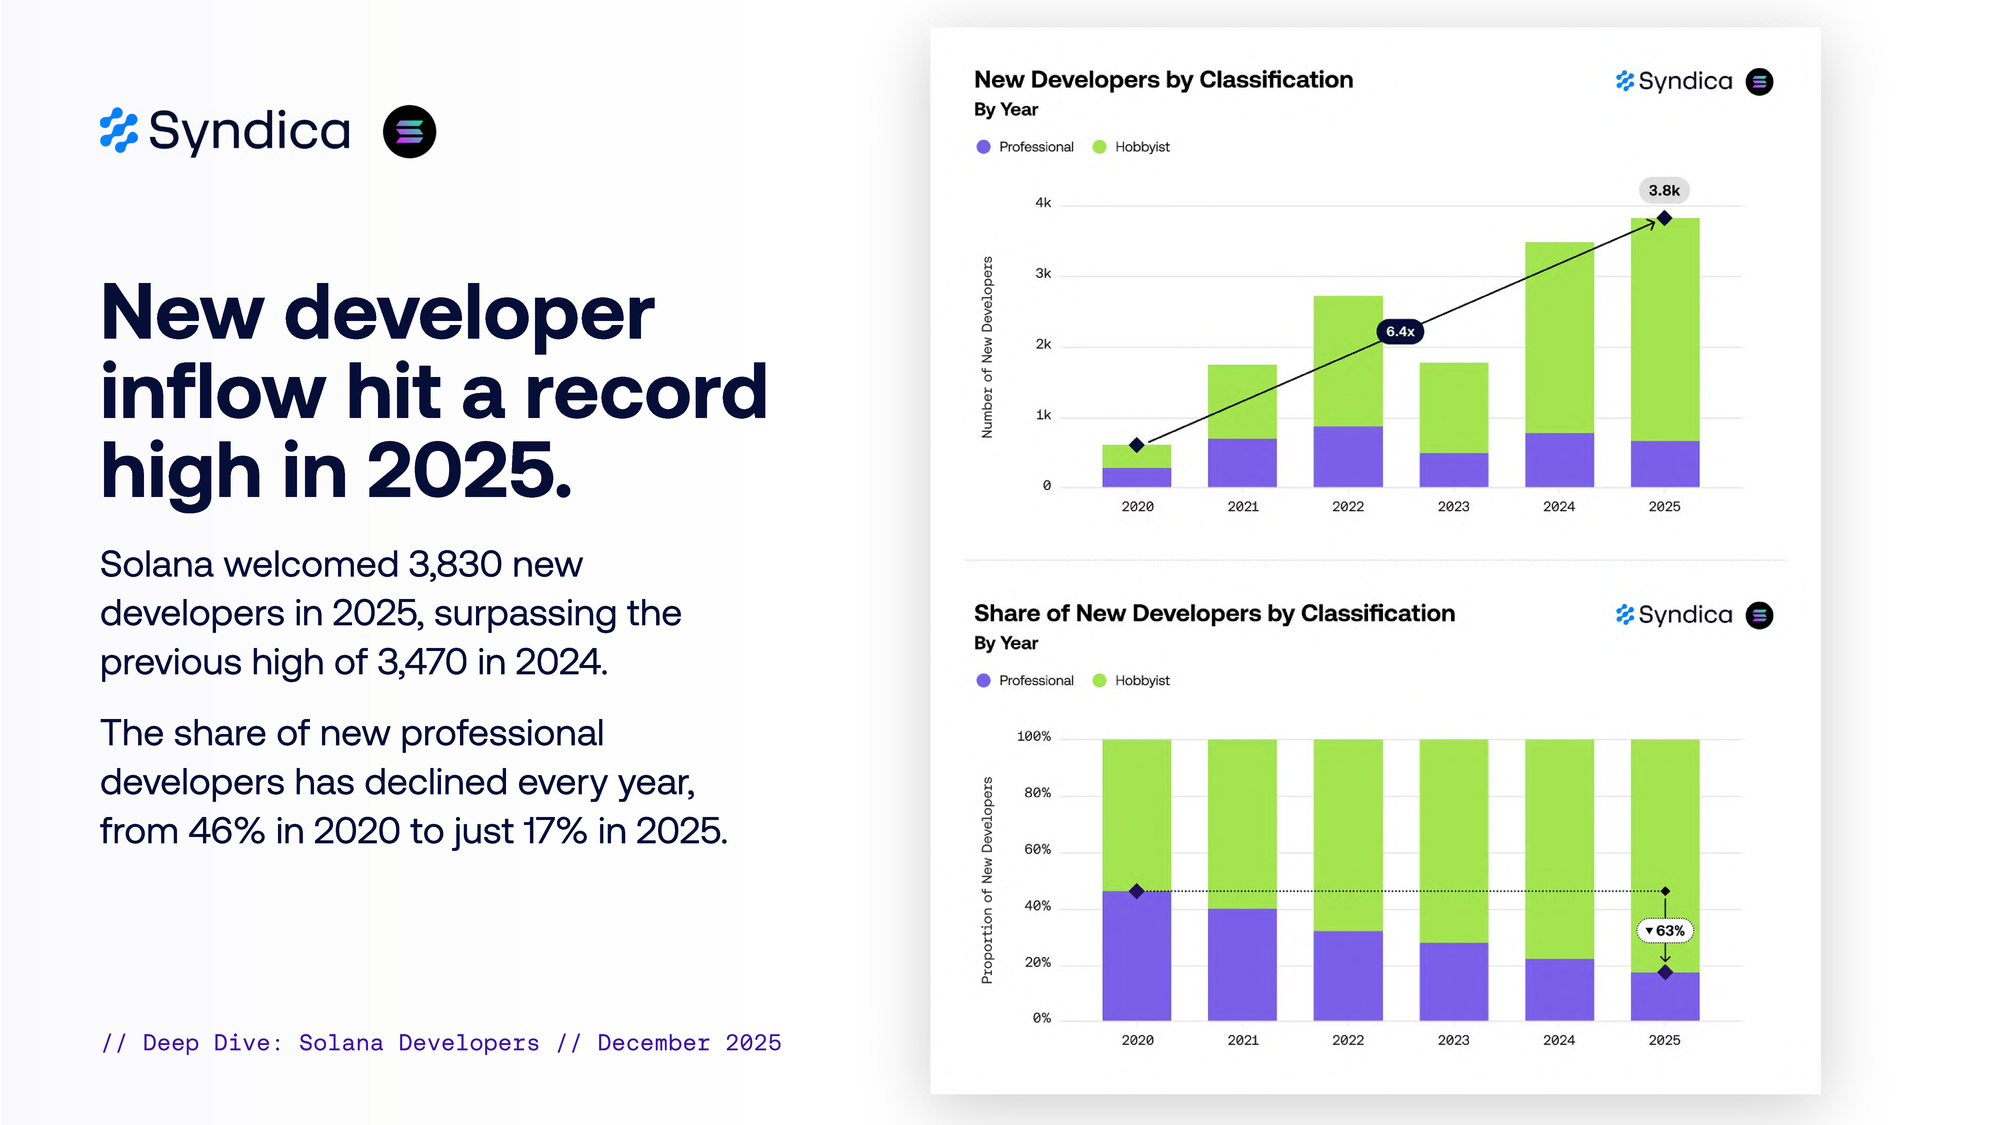
New developer inflow hit a record high in 2025.
Solana welcomed 3,830 new developers in 2025, surpassing the previous high of 3,470 in 2024.
The share of new professional developers has declined every year, from 46% in 2020 to just 17% in 2025.
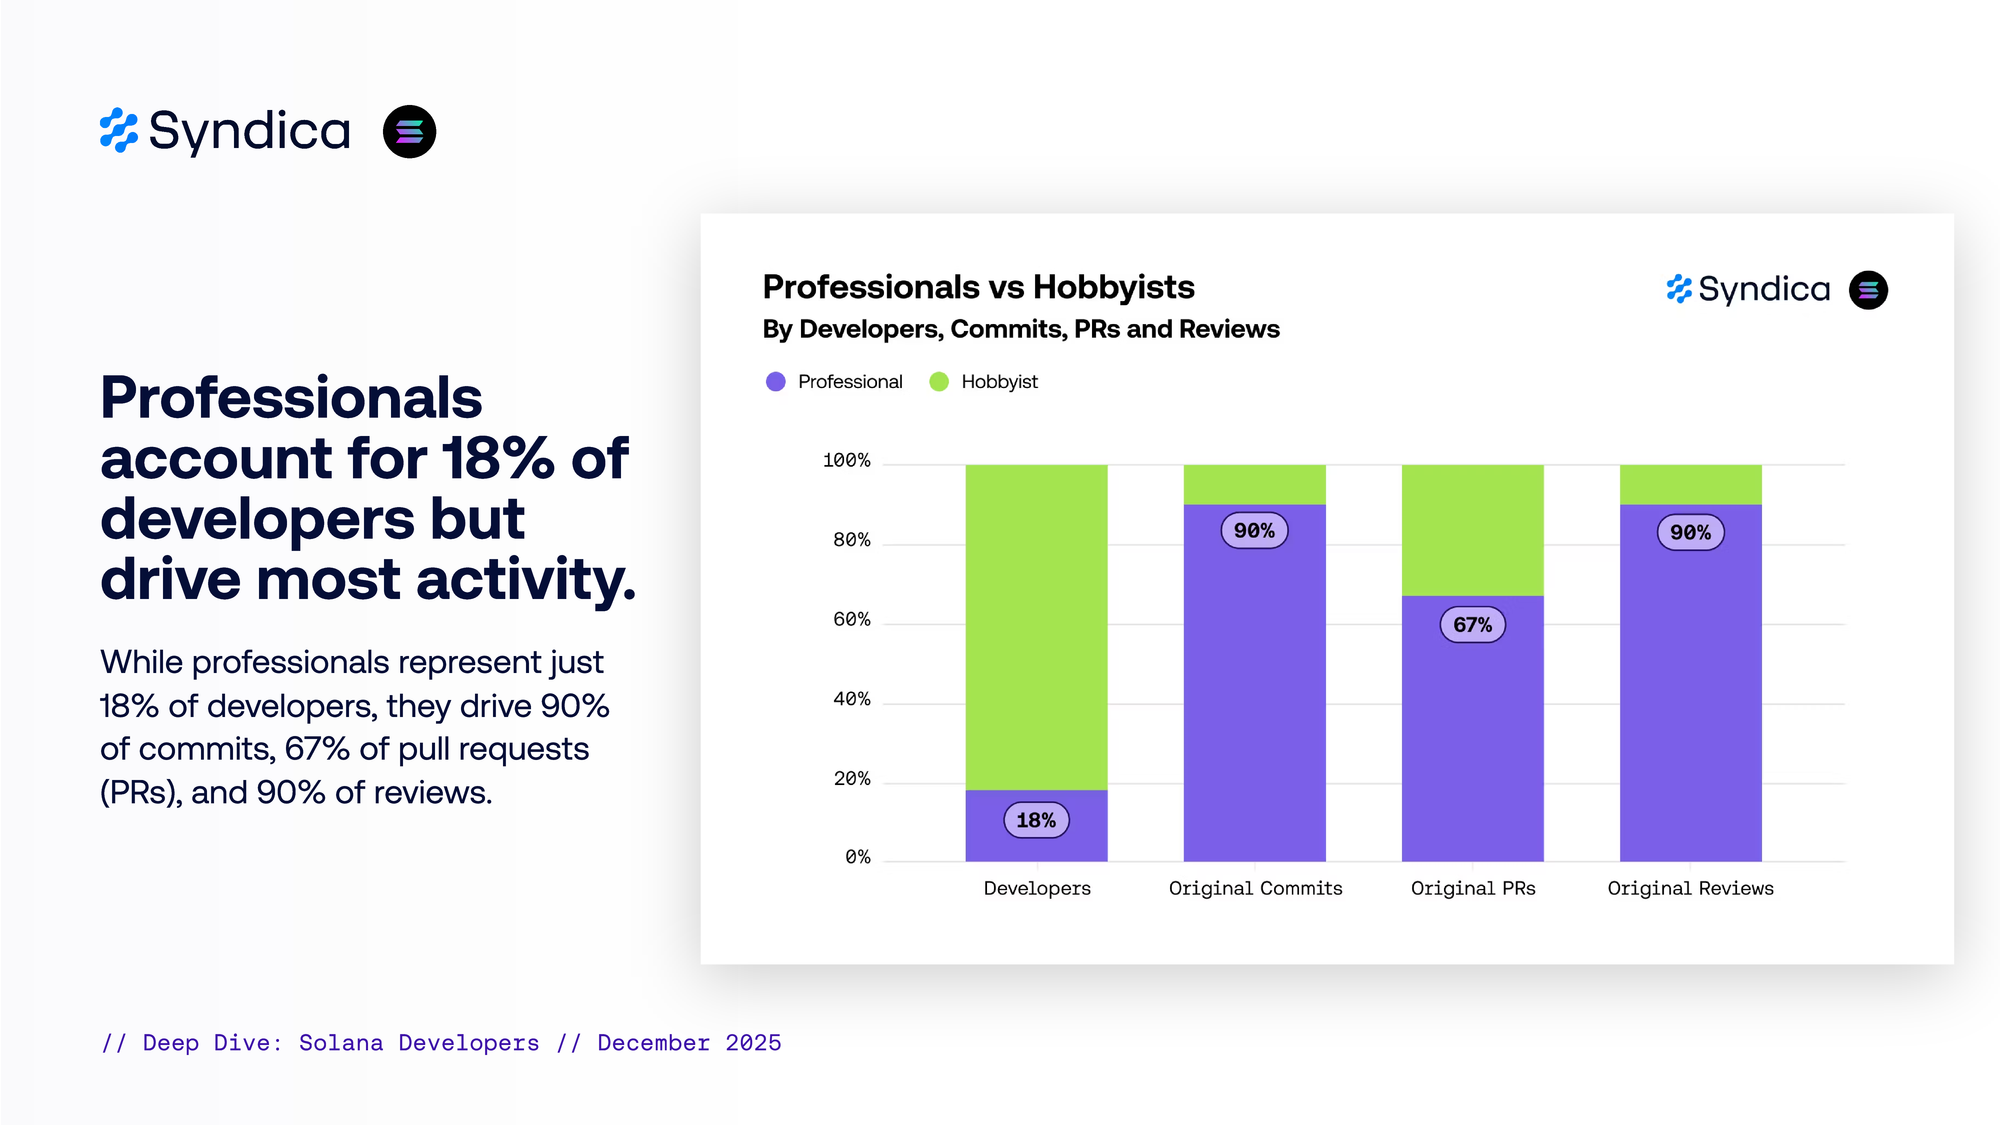
Professionals account for 18% of developers but drive most activity.
While professionals represent just 18% of developers, they drive 90% of commits, 67% of pull requests (PRs), and 90% of reviews.
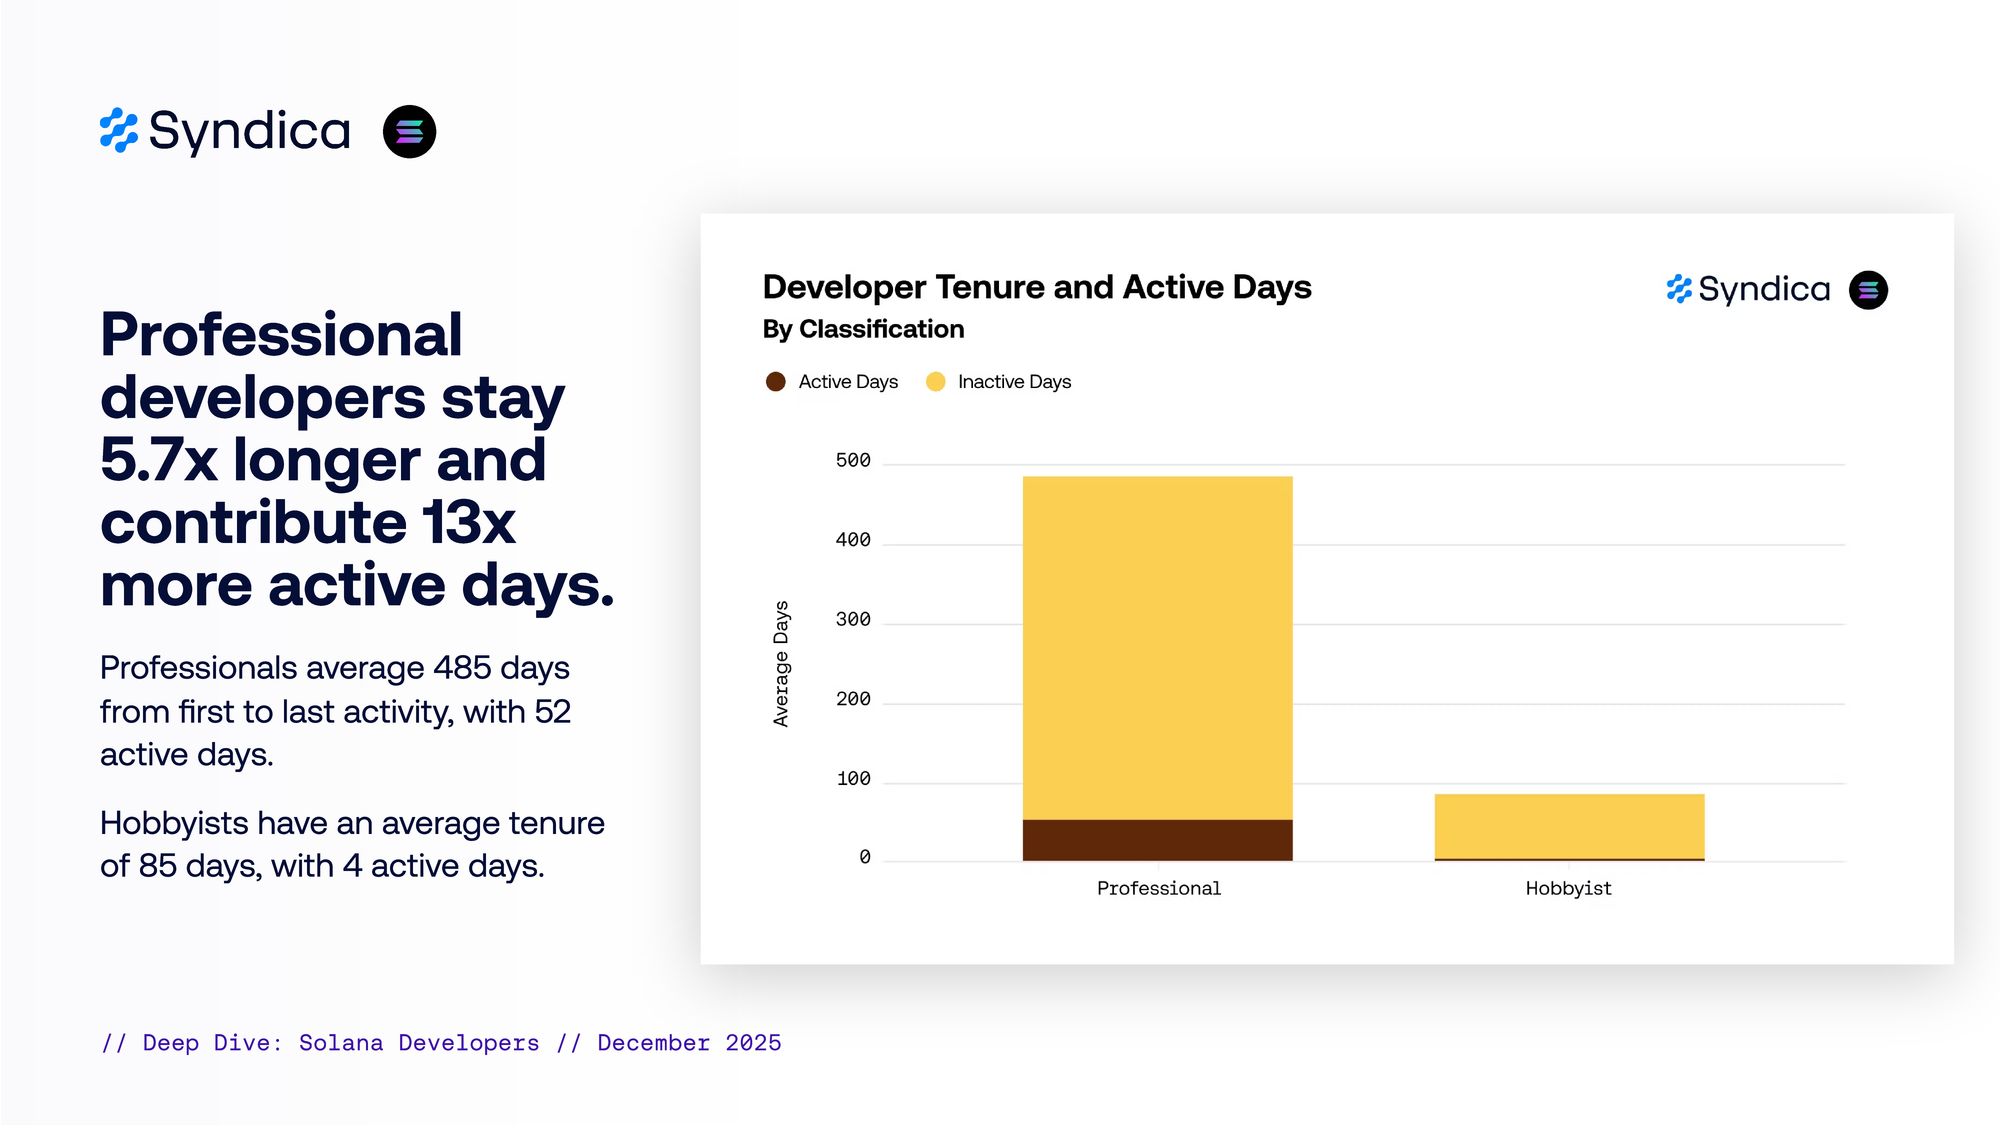
Professional developers stay 5.7x longer and contribute 13x more active days.
Professionals average 485 days from first to last activity, with 52 active days.
Hobbyists have an average tenure of 85 days, with 4 active days.
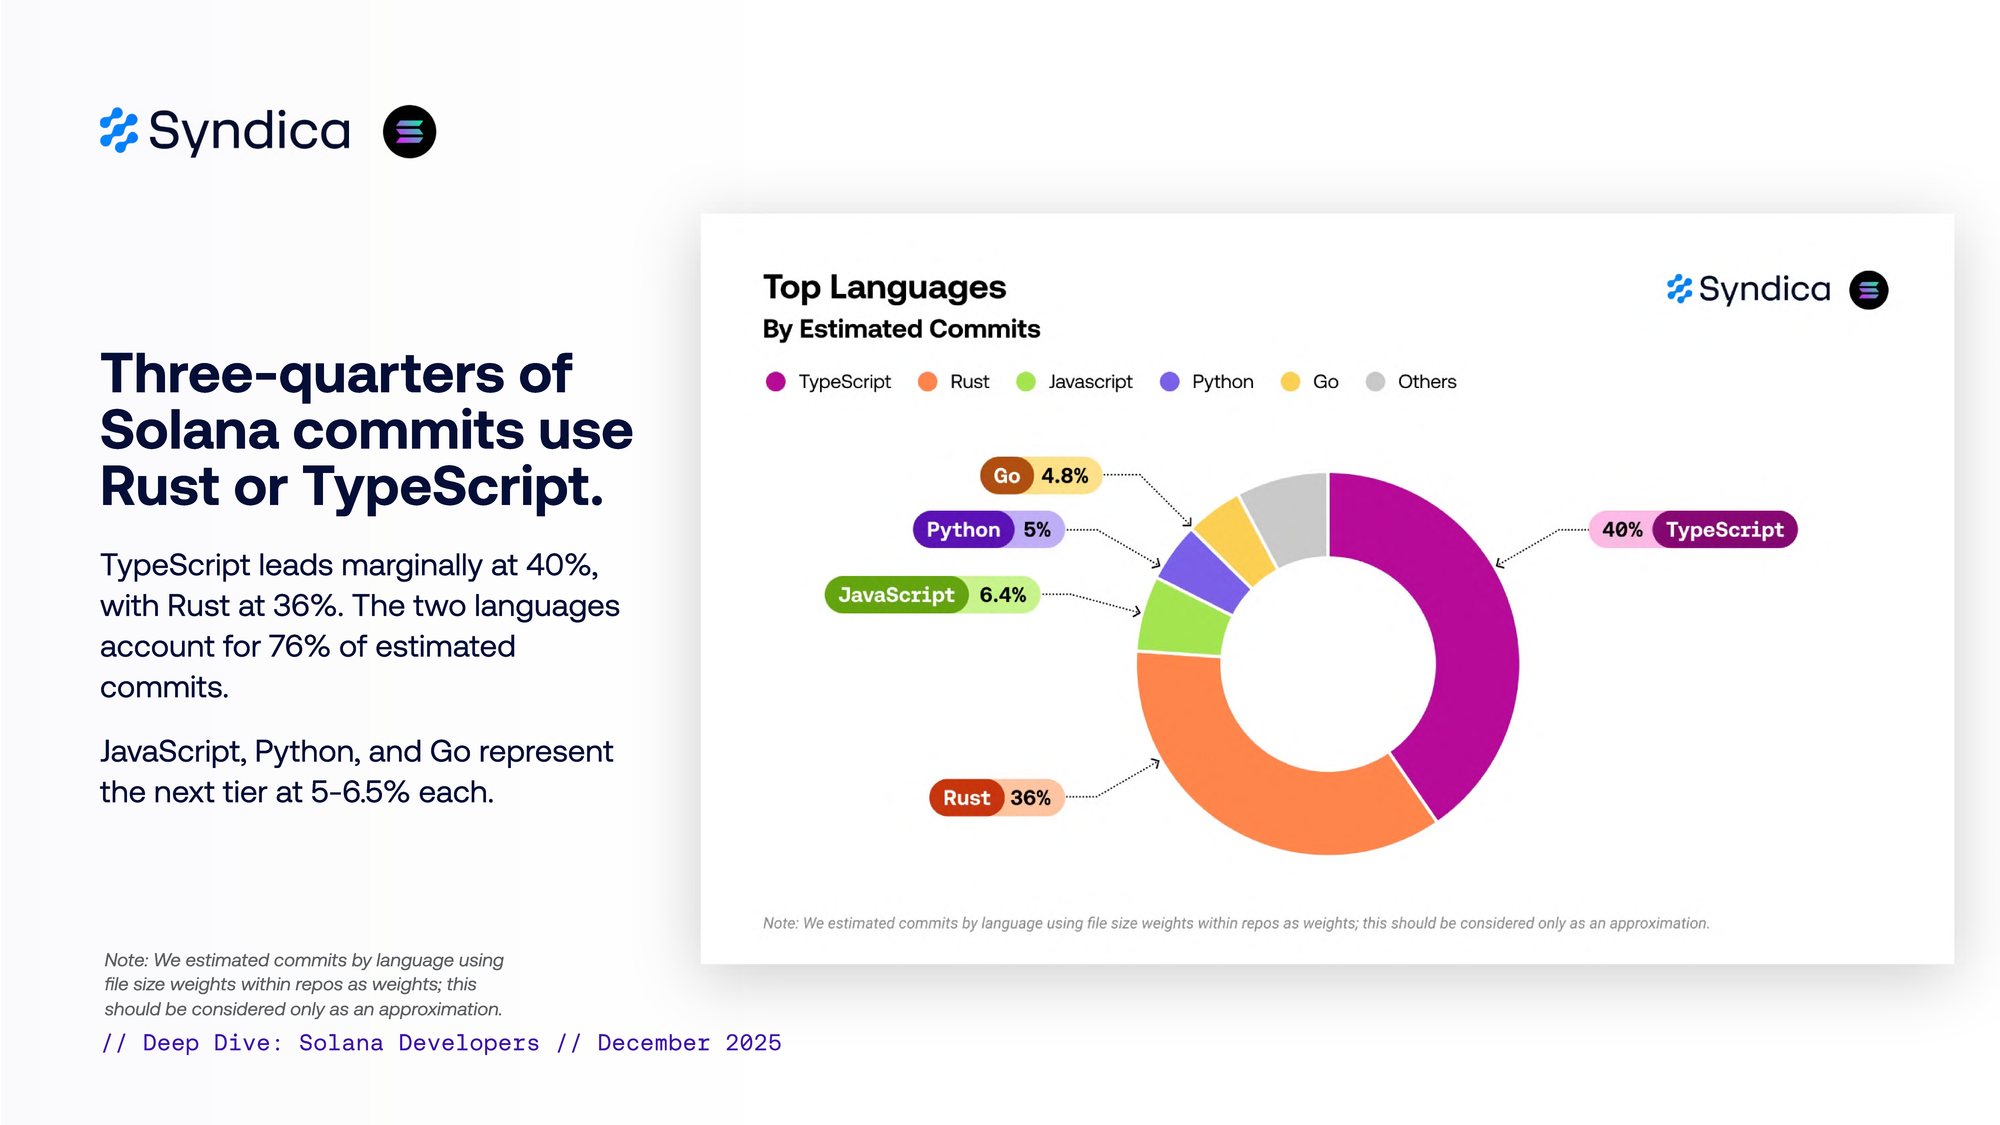
Three-quarters of Solana commits use Rust or TypeScript.
Rust leads marginally at 36%, with TypeScript at 40%. The two languages account for 76% of estimated commits.
JavaScript, Python, and Go represent the next tier at 5-6.5% each.
Note: We estimated commits by language using file size weights within repos as weights; this should be considered only as an approximation.
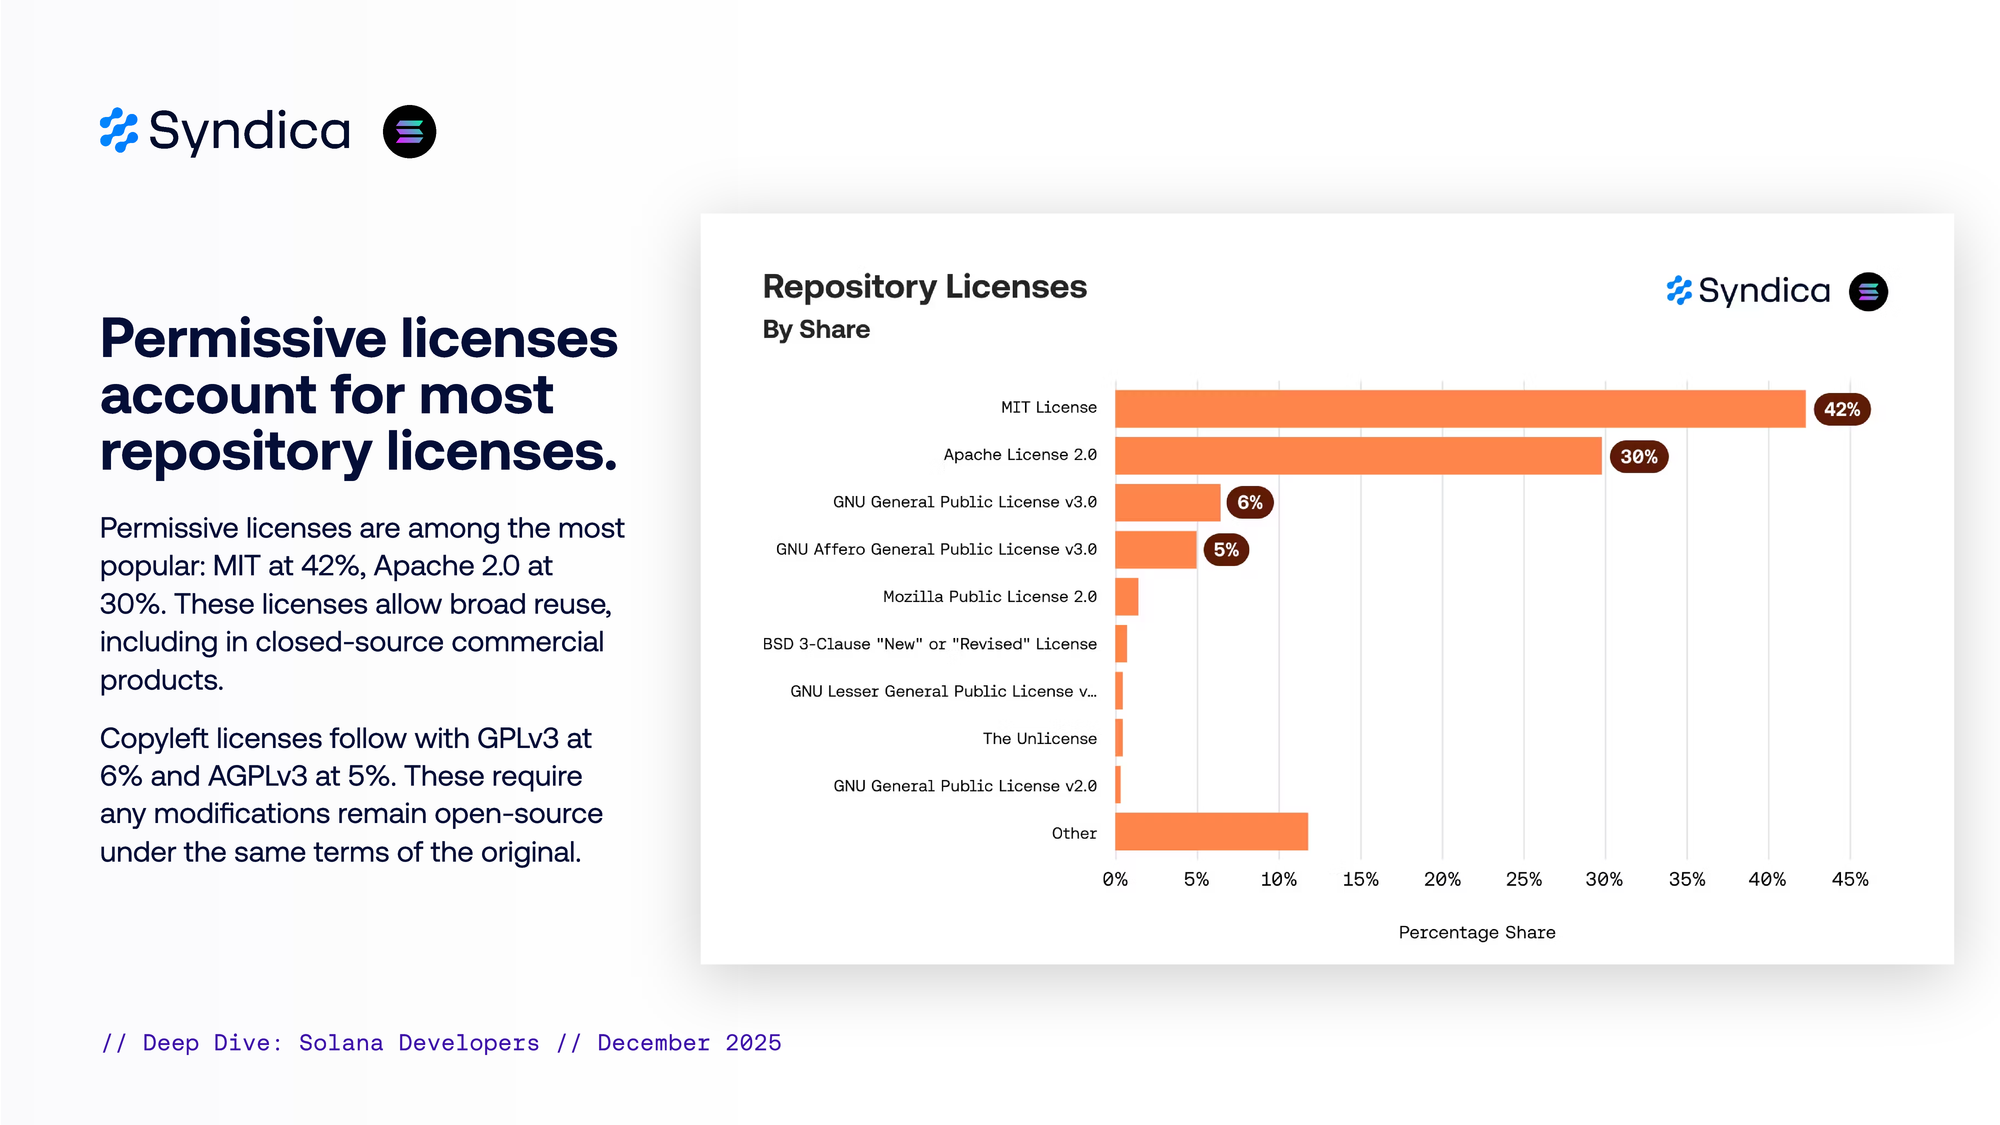
Permissive licenses account for most repository licenses.
Permissive licenses are among the most popular: MIT at 42%, Apache 2.0 at 30%. These licenses allow broad reuse, including in closed-source commercial products.
Copyleft licenses follow with GPLv3 at 6% and AGPLv3 at 5%. These require any modifications remain open-source under the same terms of the original.
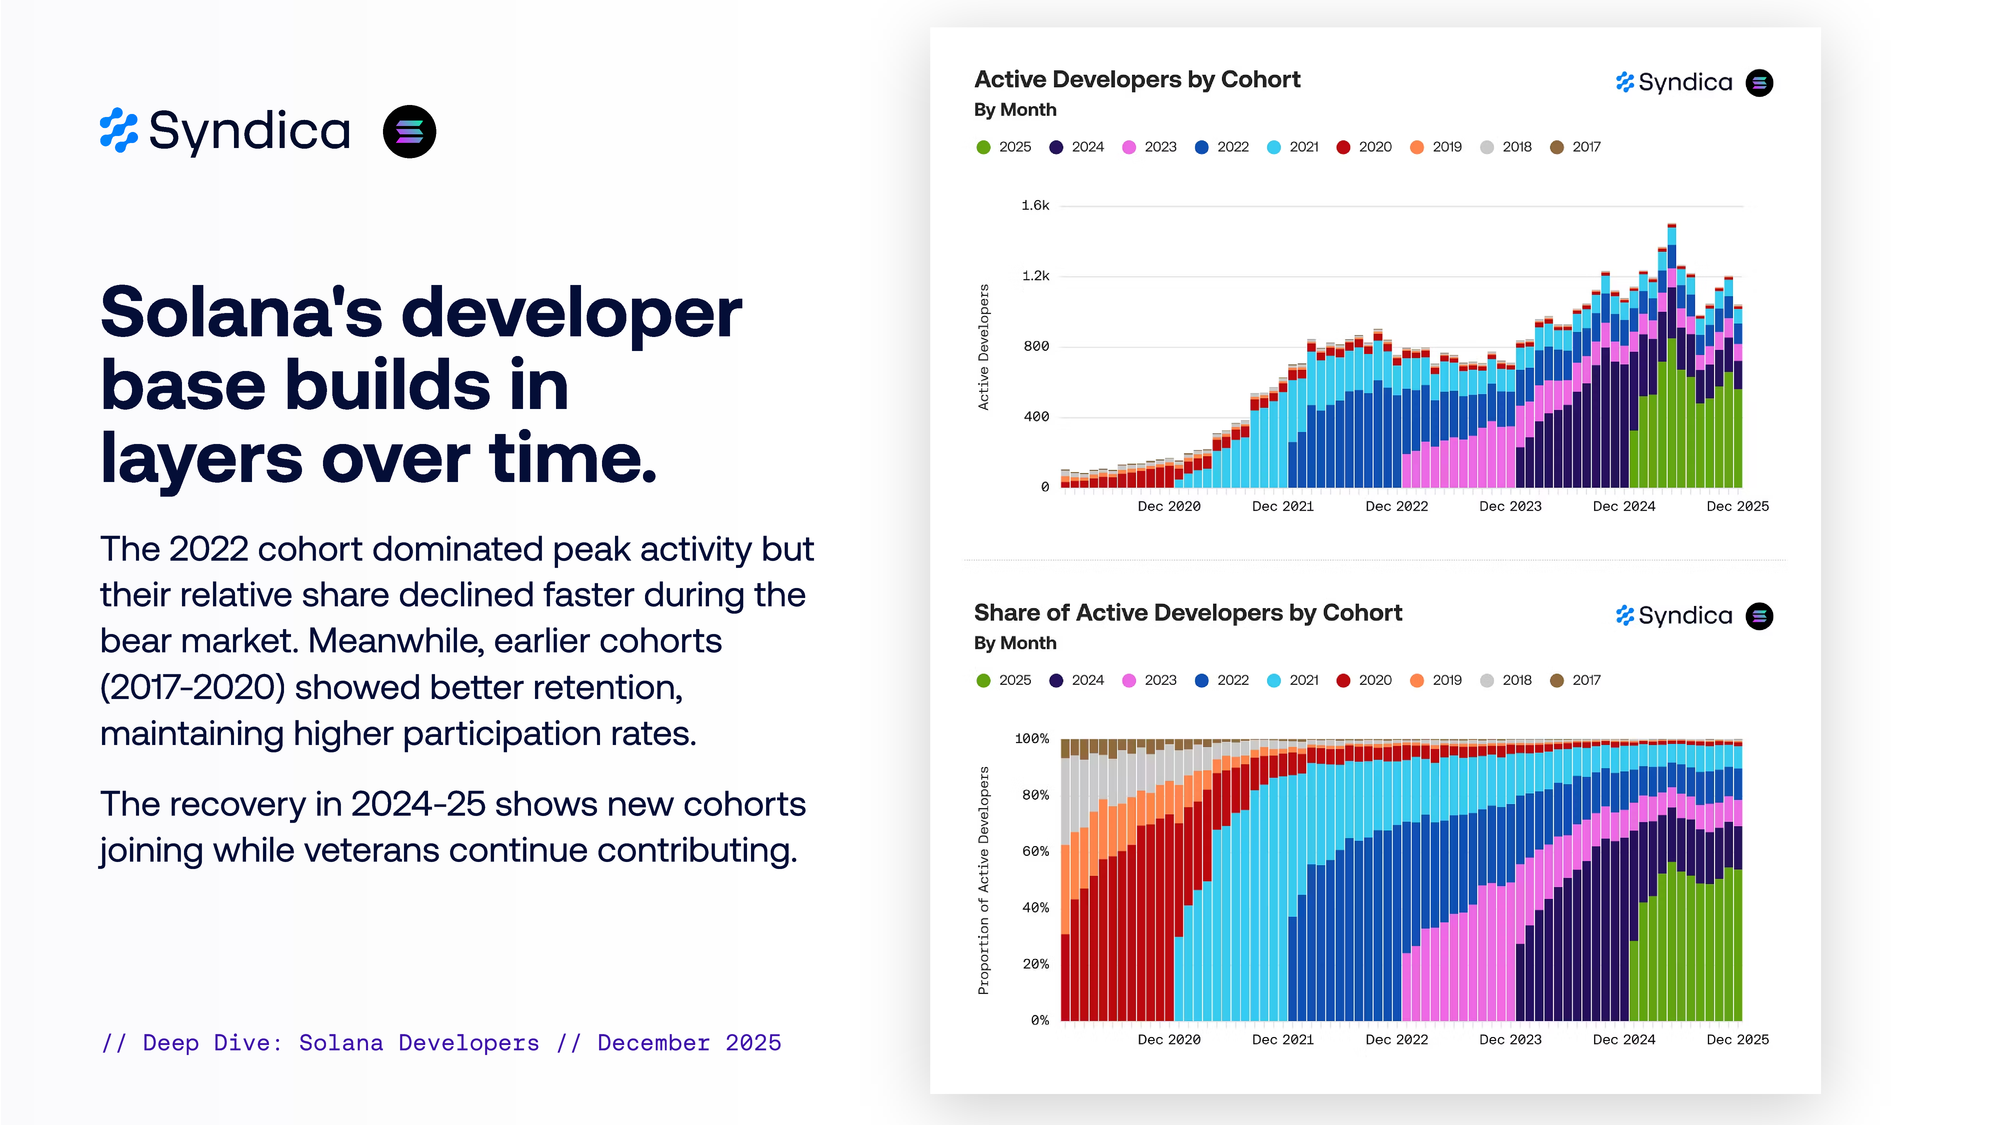
Solana’s developer base builds in layers over time.
The 2022 cohort dominated peak activity but their relative share declined faster during the bear market. Meanwhile, earlier cohorts (2017-2020) showed better retention, maintaining higher participation rates.
The recovery in 2024-25 shows new cohorts joining while veterans continue contributing.
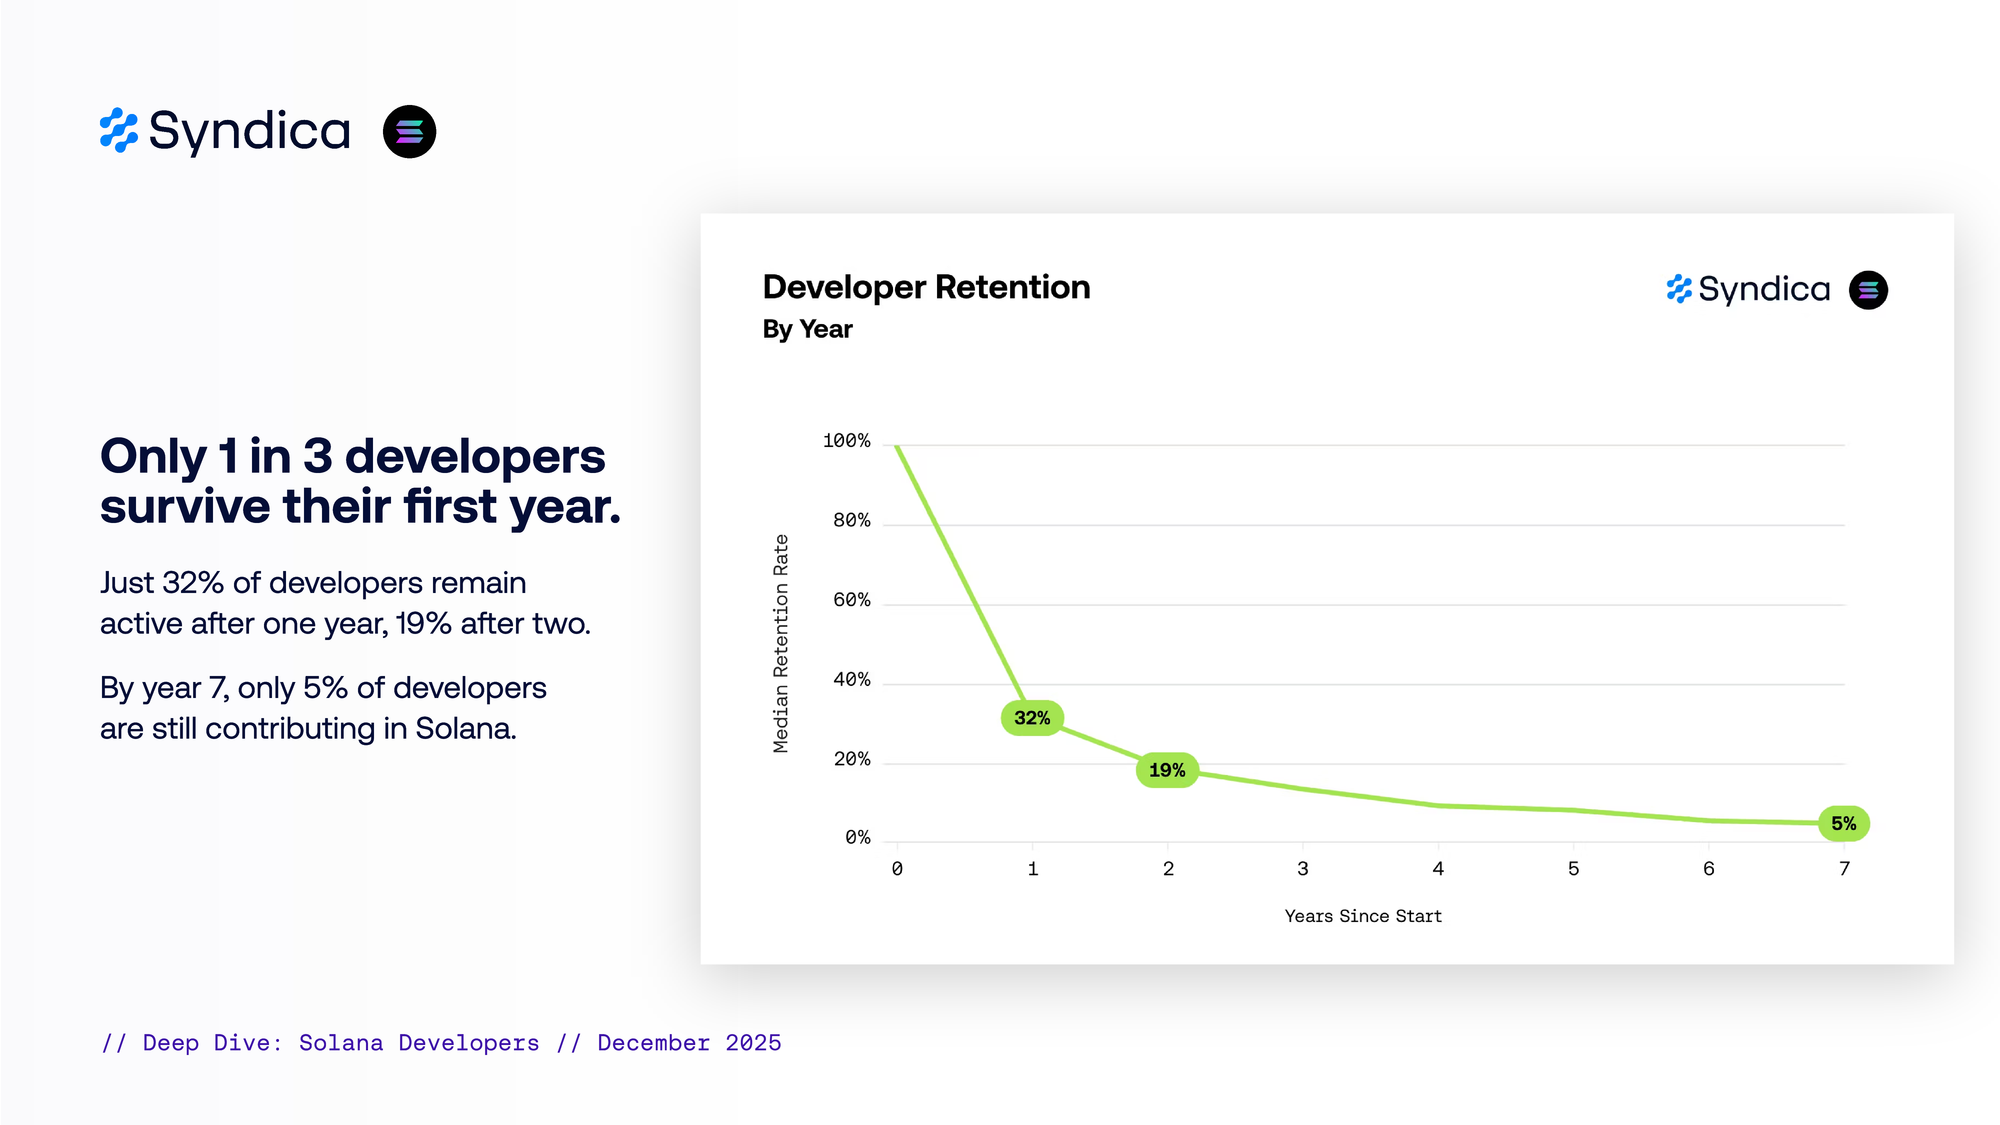
Only 1 in 3 developers survive their first year.
Just 32% of developers remain active after one year, 19% after two. By year 7, only 5% of developers are still contributing in Solana.
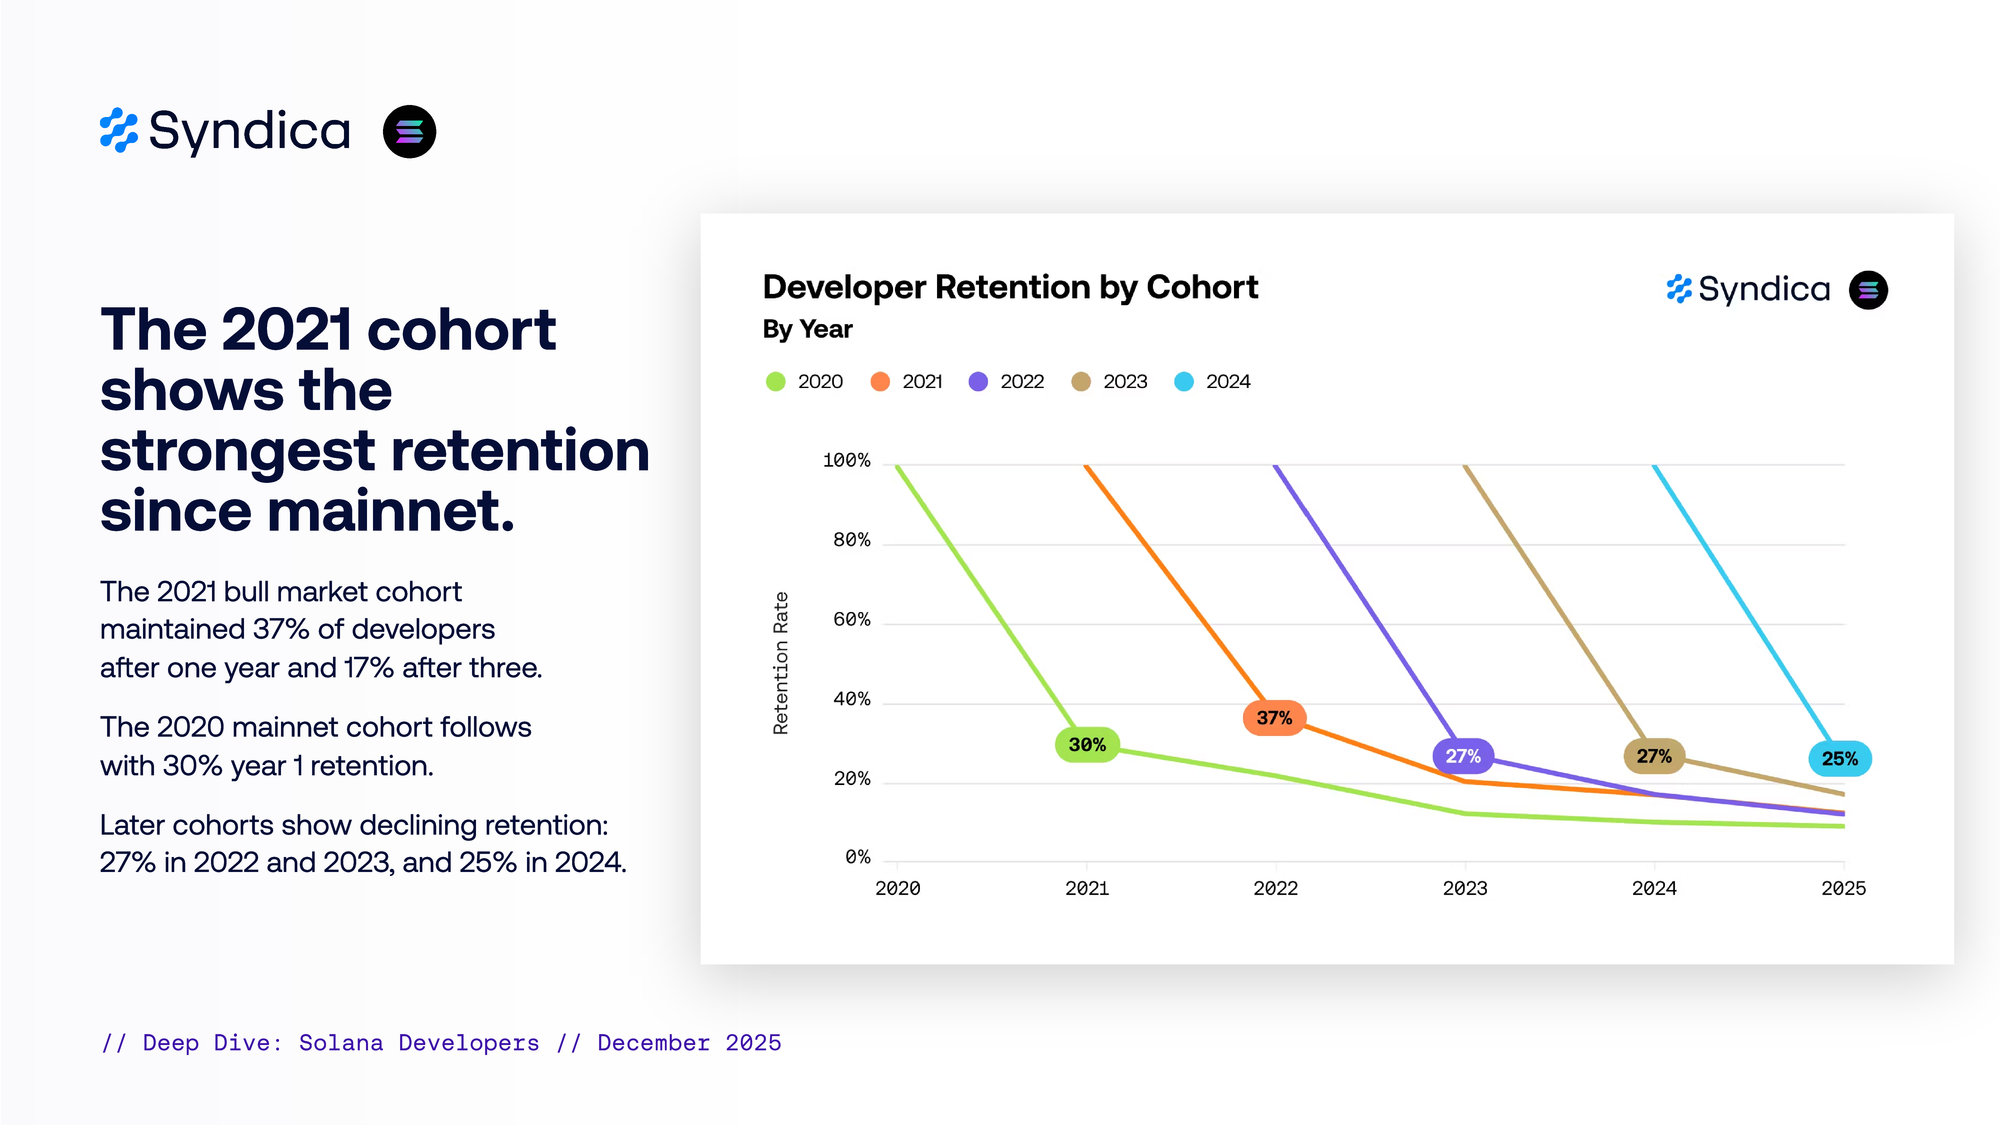
The 2021 cohort shows the strongest retention since mainnet.
The 2021 bull market cohort maintained 37% of developers after one year and 17% after three.
The 2020 mainnet cohort follows with 30% year 1 retention.
Later cohorts show declining retention: 27% in 2022 and 2023, and 25% in 2024.
Part II
Validator Clients
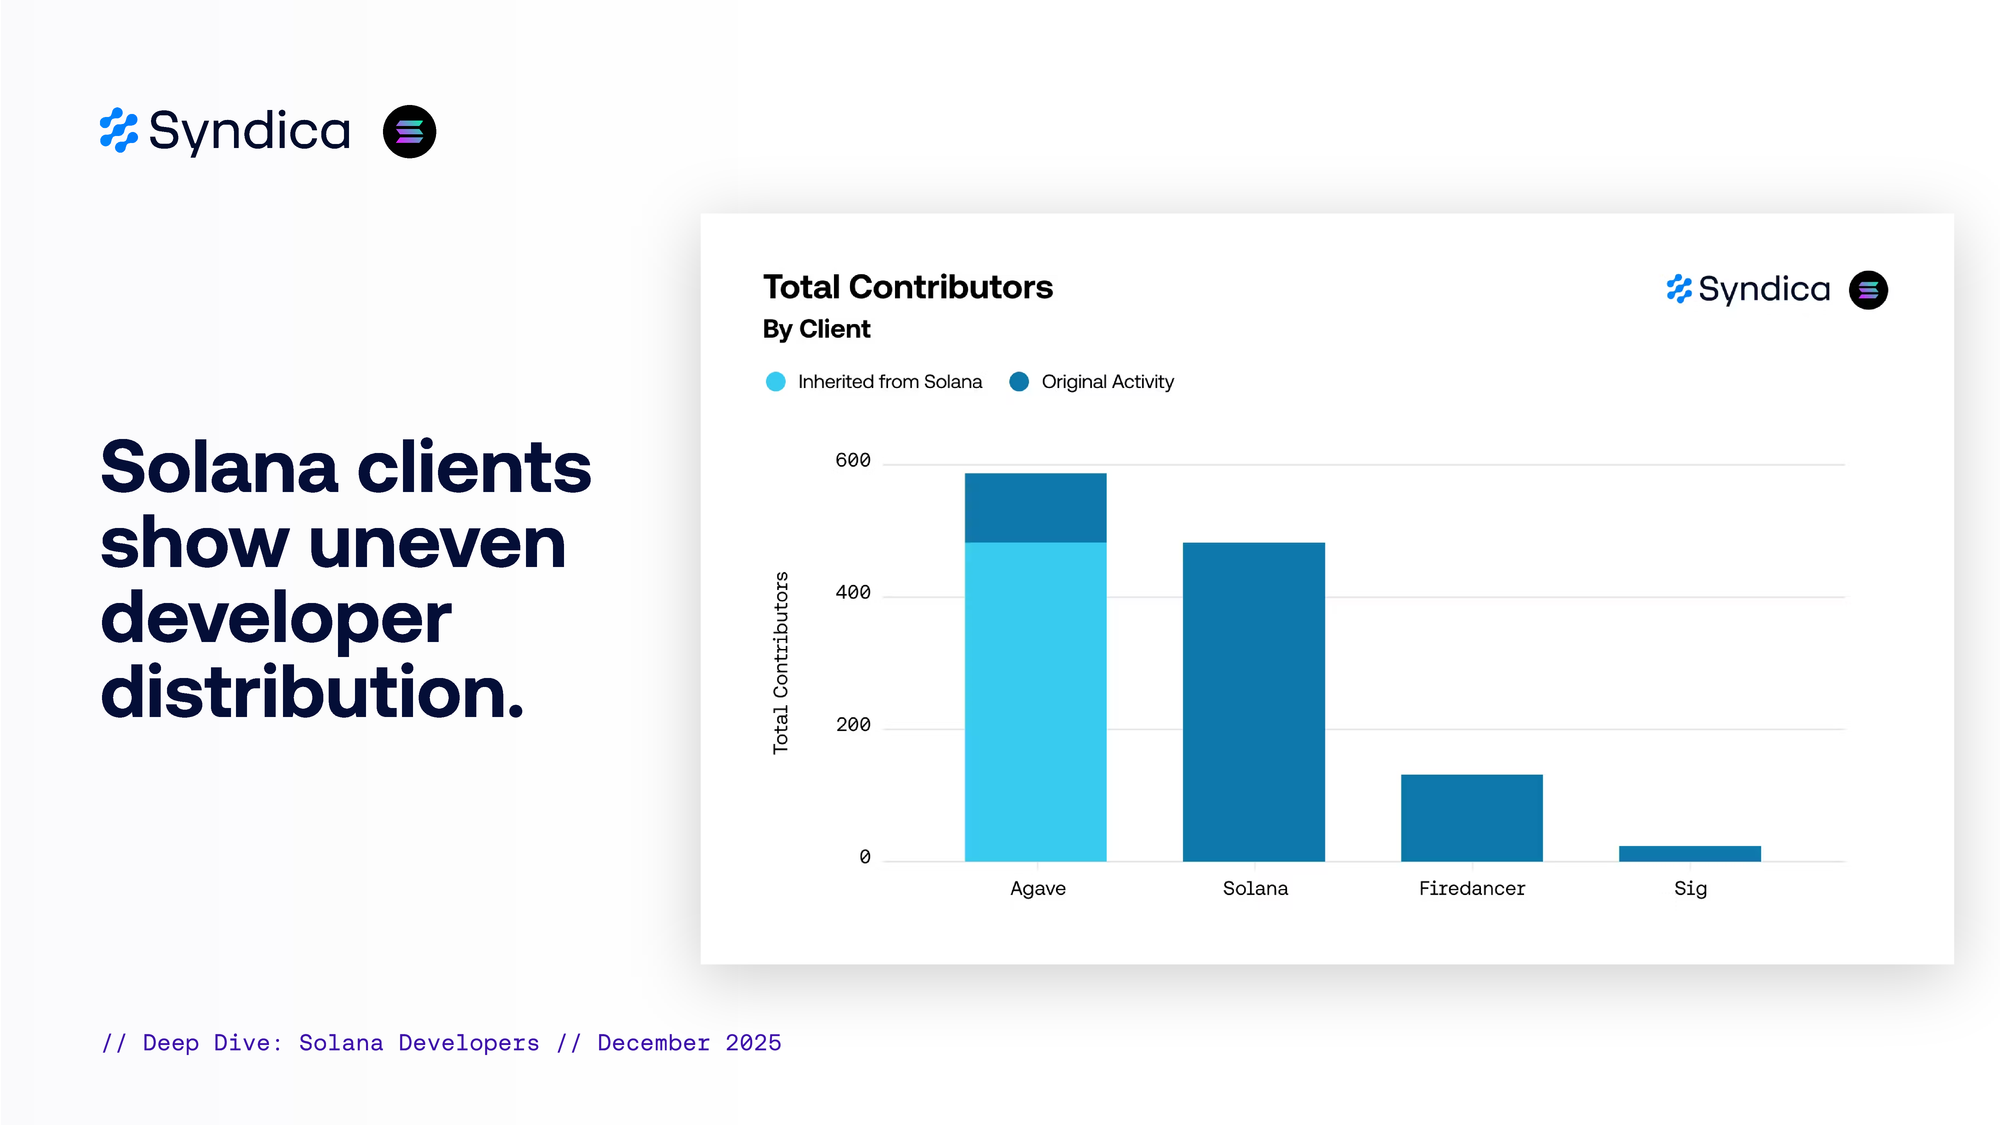
Solana clients show uneven developer distribution.
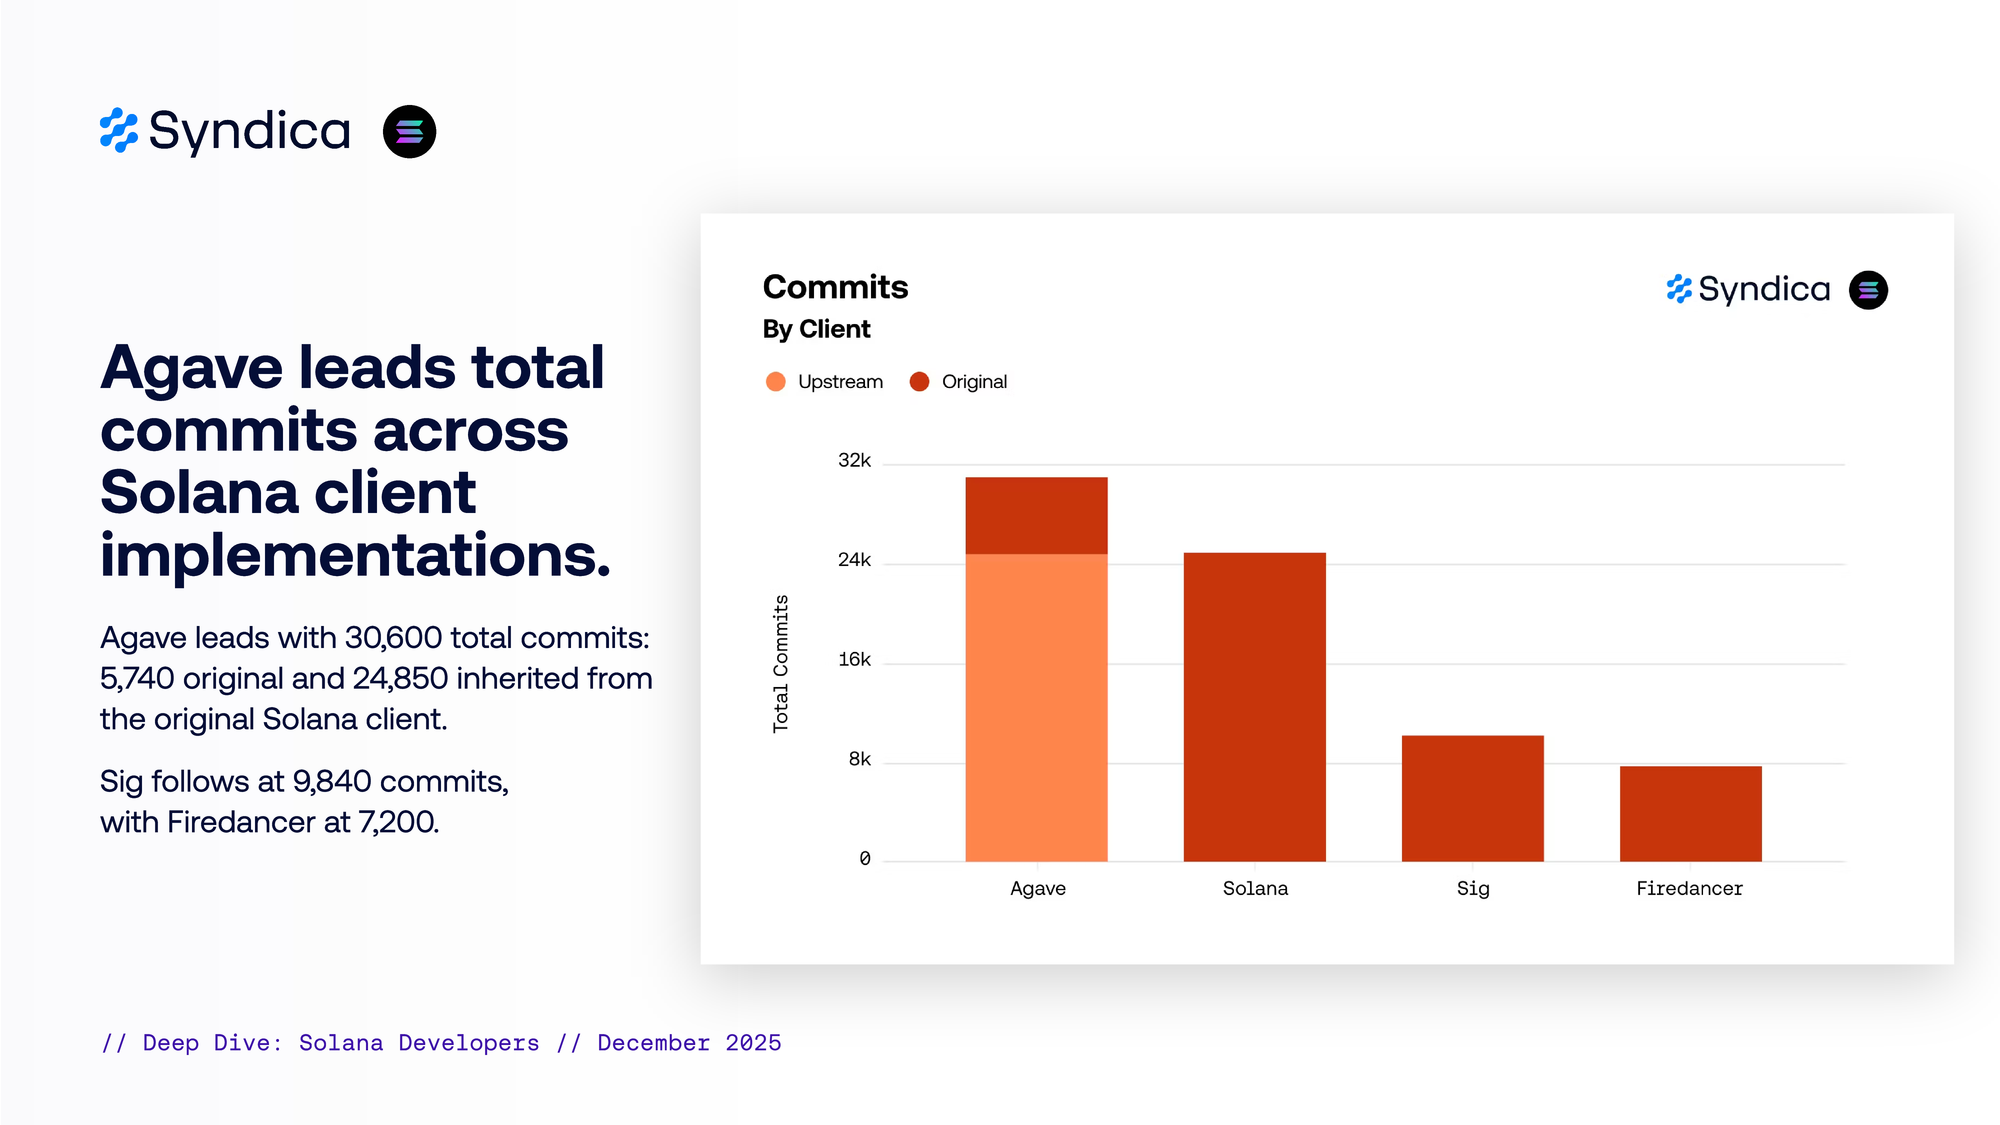
Agave leads total commits across Solana client implementations.
Agave leads with 30,600 total commits: 5,740 original and 24,850 inherited from the original Solana client.
Sig follows at 9,840 commits, with Firedancer at 7,200.
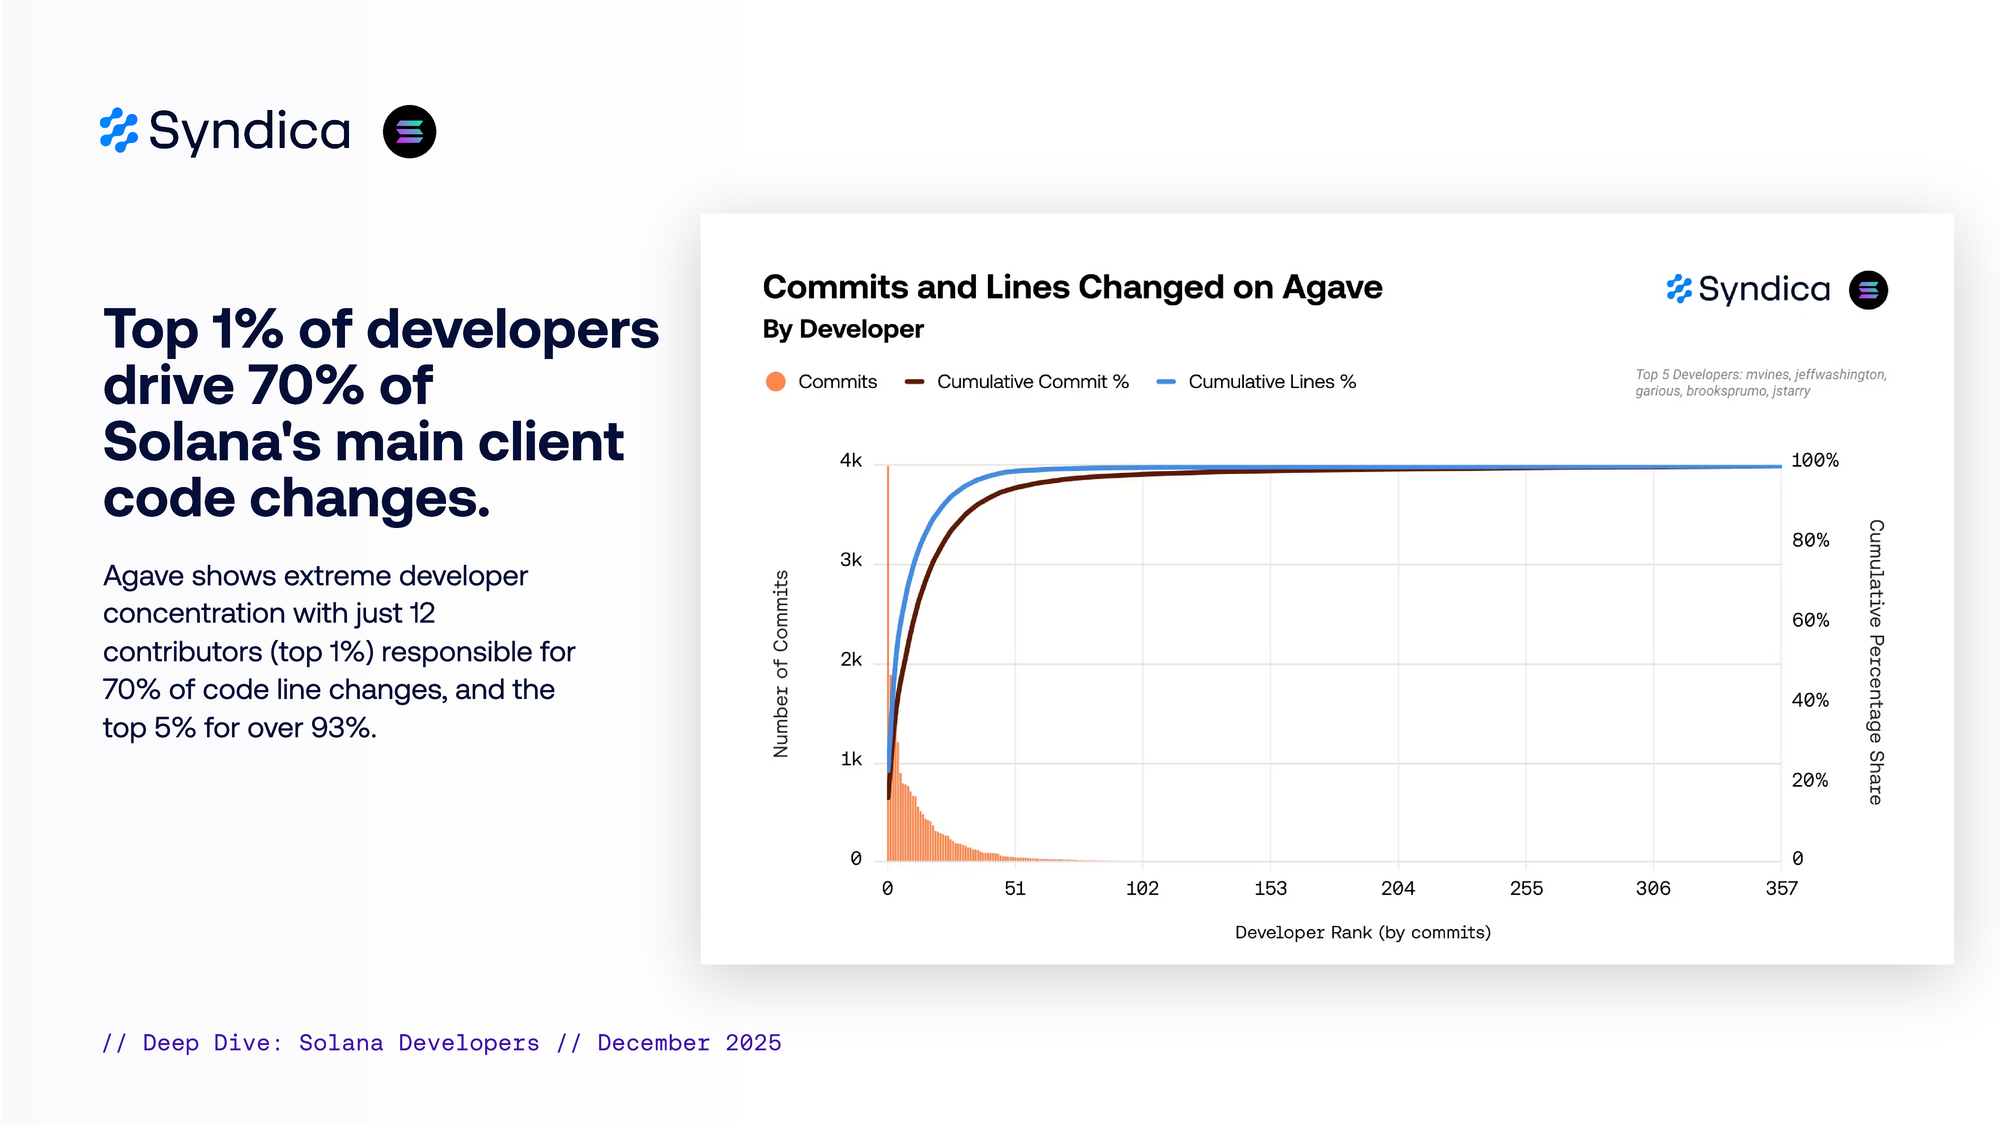
Top 1% of developers drive 70% of Solana’s main client code changes.
Agave shows extreme developer concentration with just 12 contributors (top 1%) responsible for 70% of code line changes, and the top 5% for over 93%.
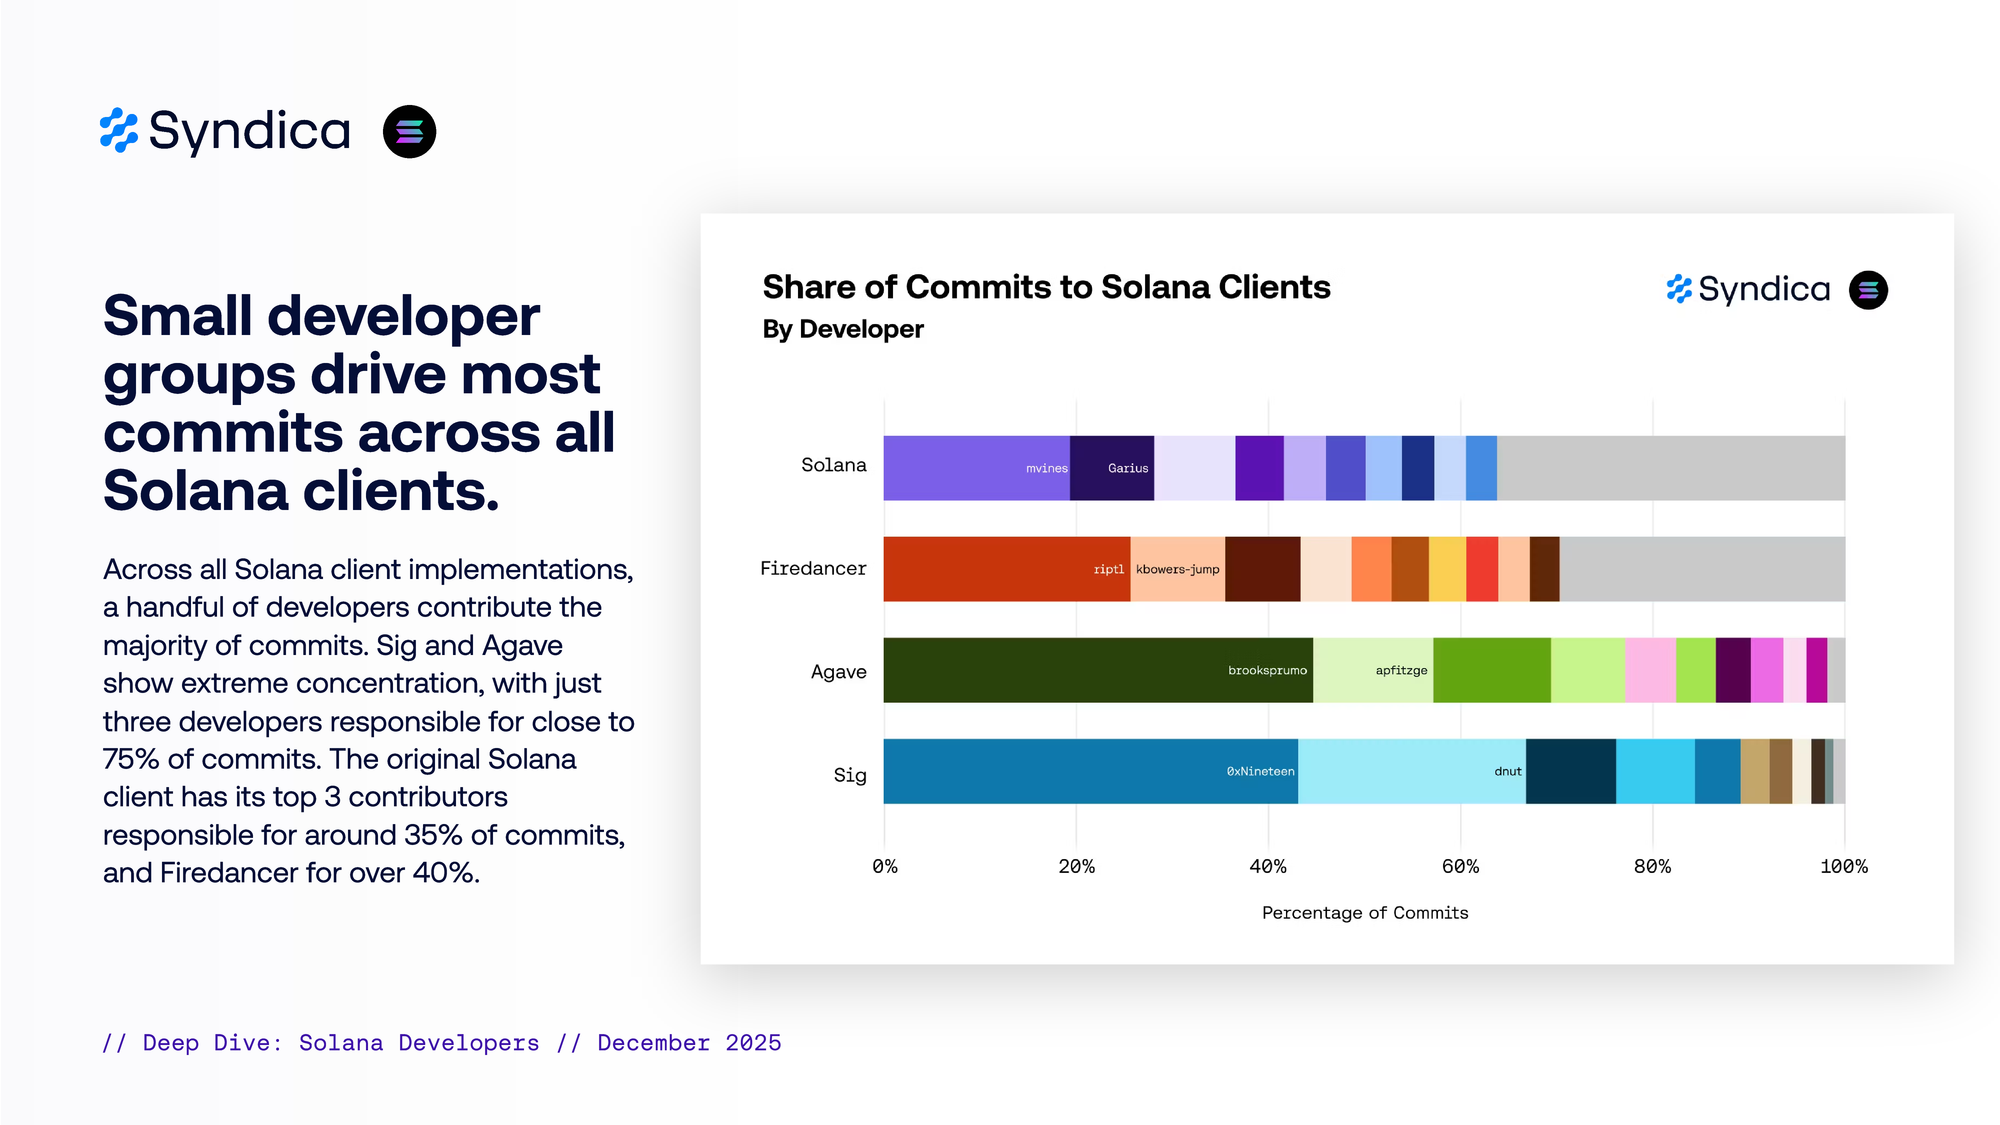
Small developer groups drive most commits across all Solana clients.
Across all Solana client implementations, a handful of developers contribute the majority of commits. Sig and Agave show extreme concentration, with just three developers responsible for close to 75% of commits.
The original Solana client has its top 3 contributors responsible for around 35% of commits, and Firedancer for over 40%.
Part III
Geography: All Developers
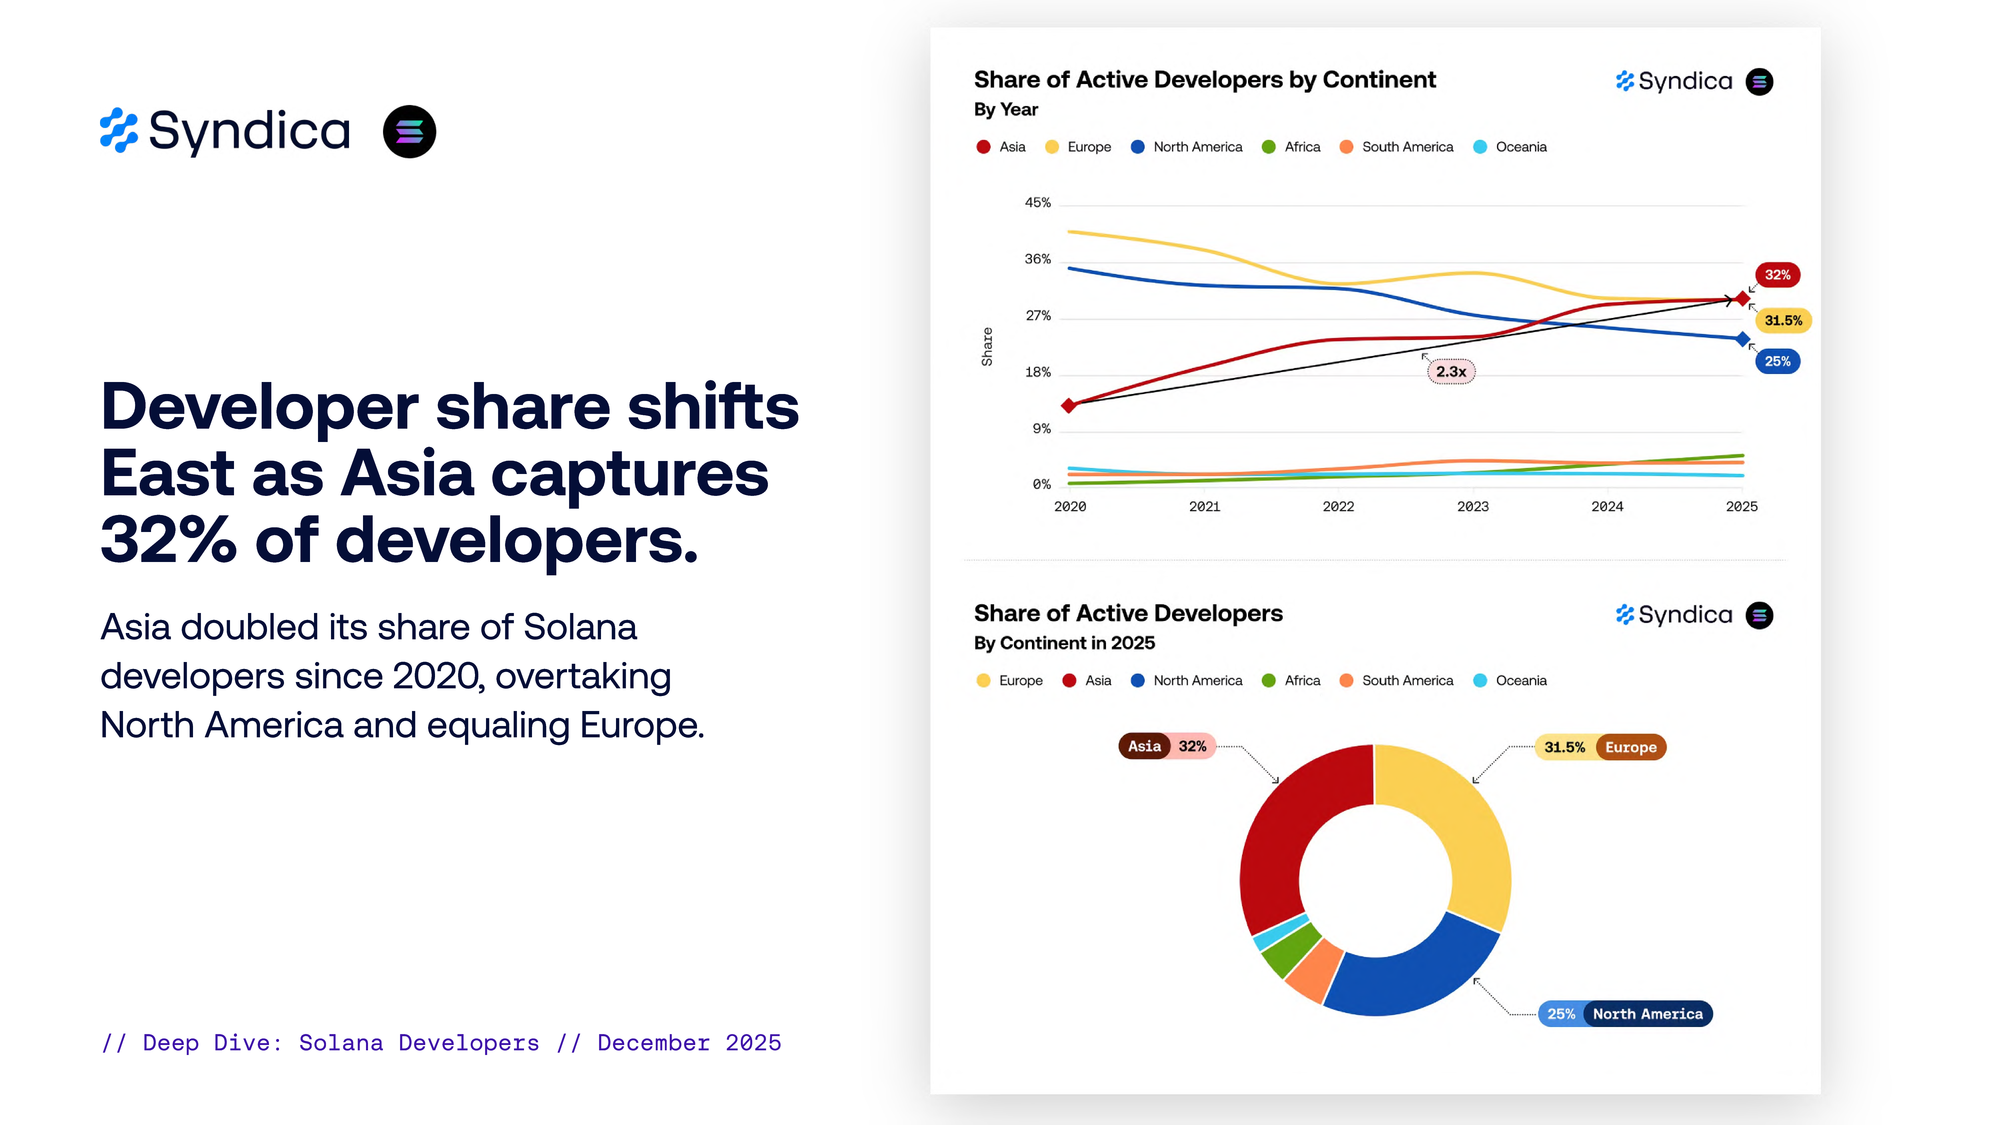
Developer share shifts East as Asia captures 31.5% of developers.
Asia doubled its share of Solana developers since 2020, overtaking North America and equaling Europe.
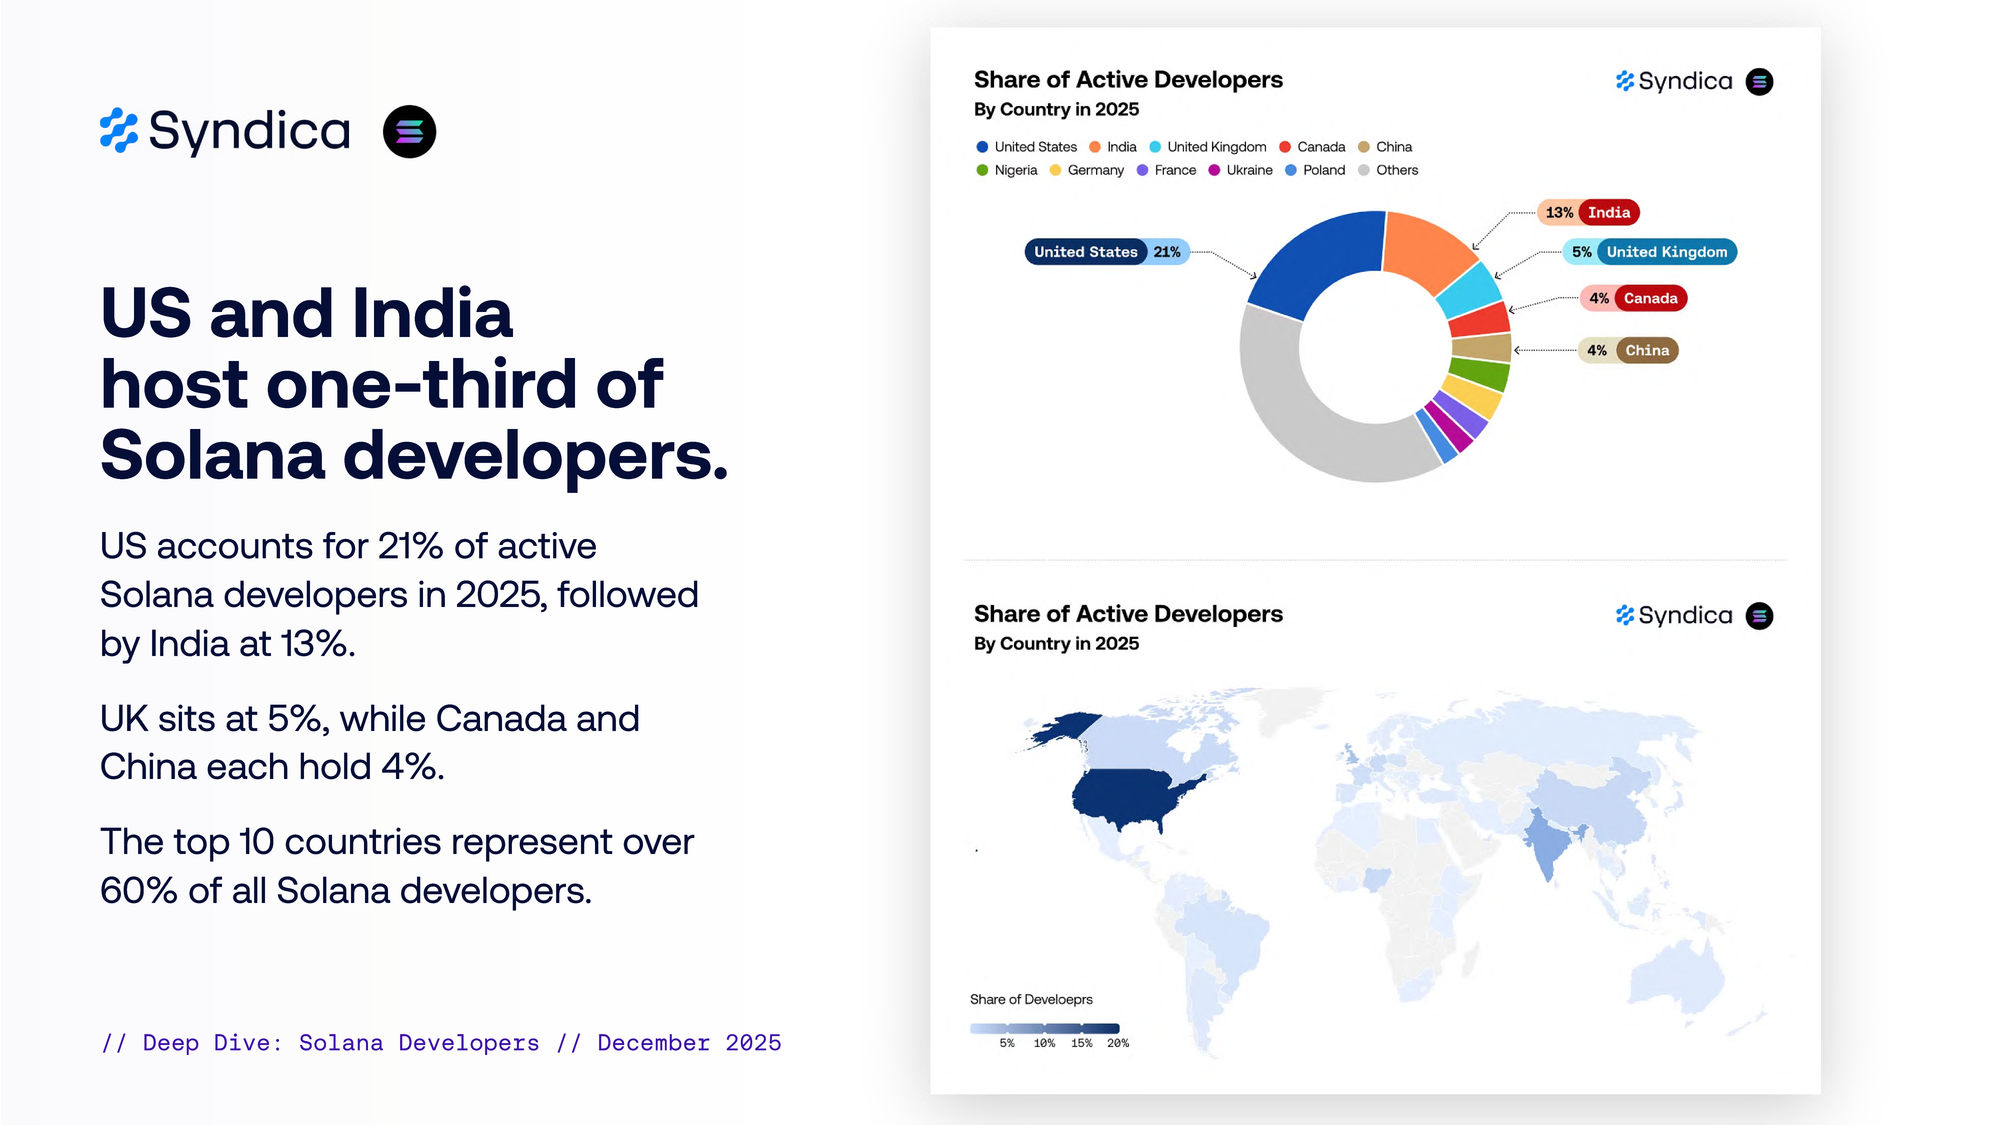
US and India host one-third of Solana developers.
US accounts for 21% of active Solana developers in 2025, followed by India at 13%.
UK sits at 5%, while Canada and China each hold 4%.
The top 10 countries represent over 60% of all Solana developers.
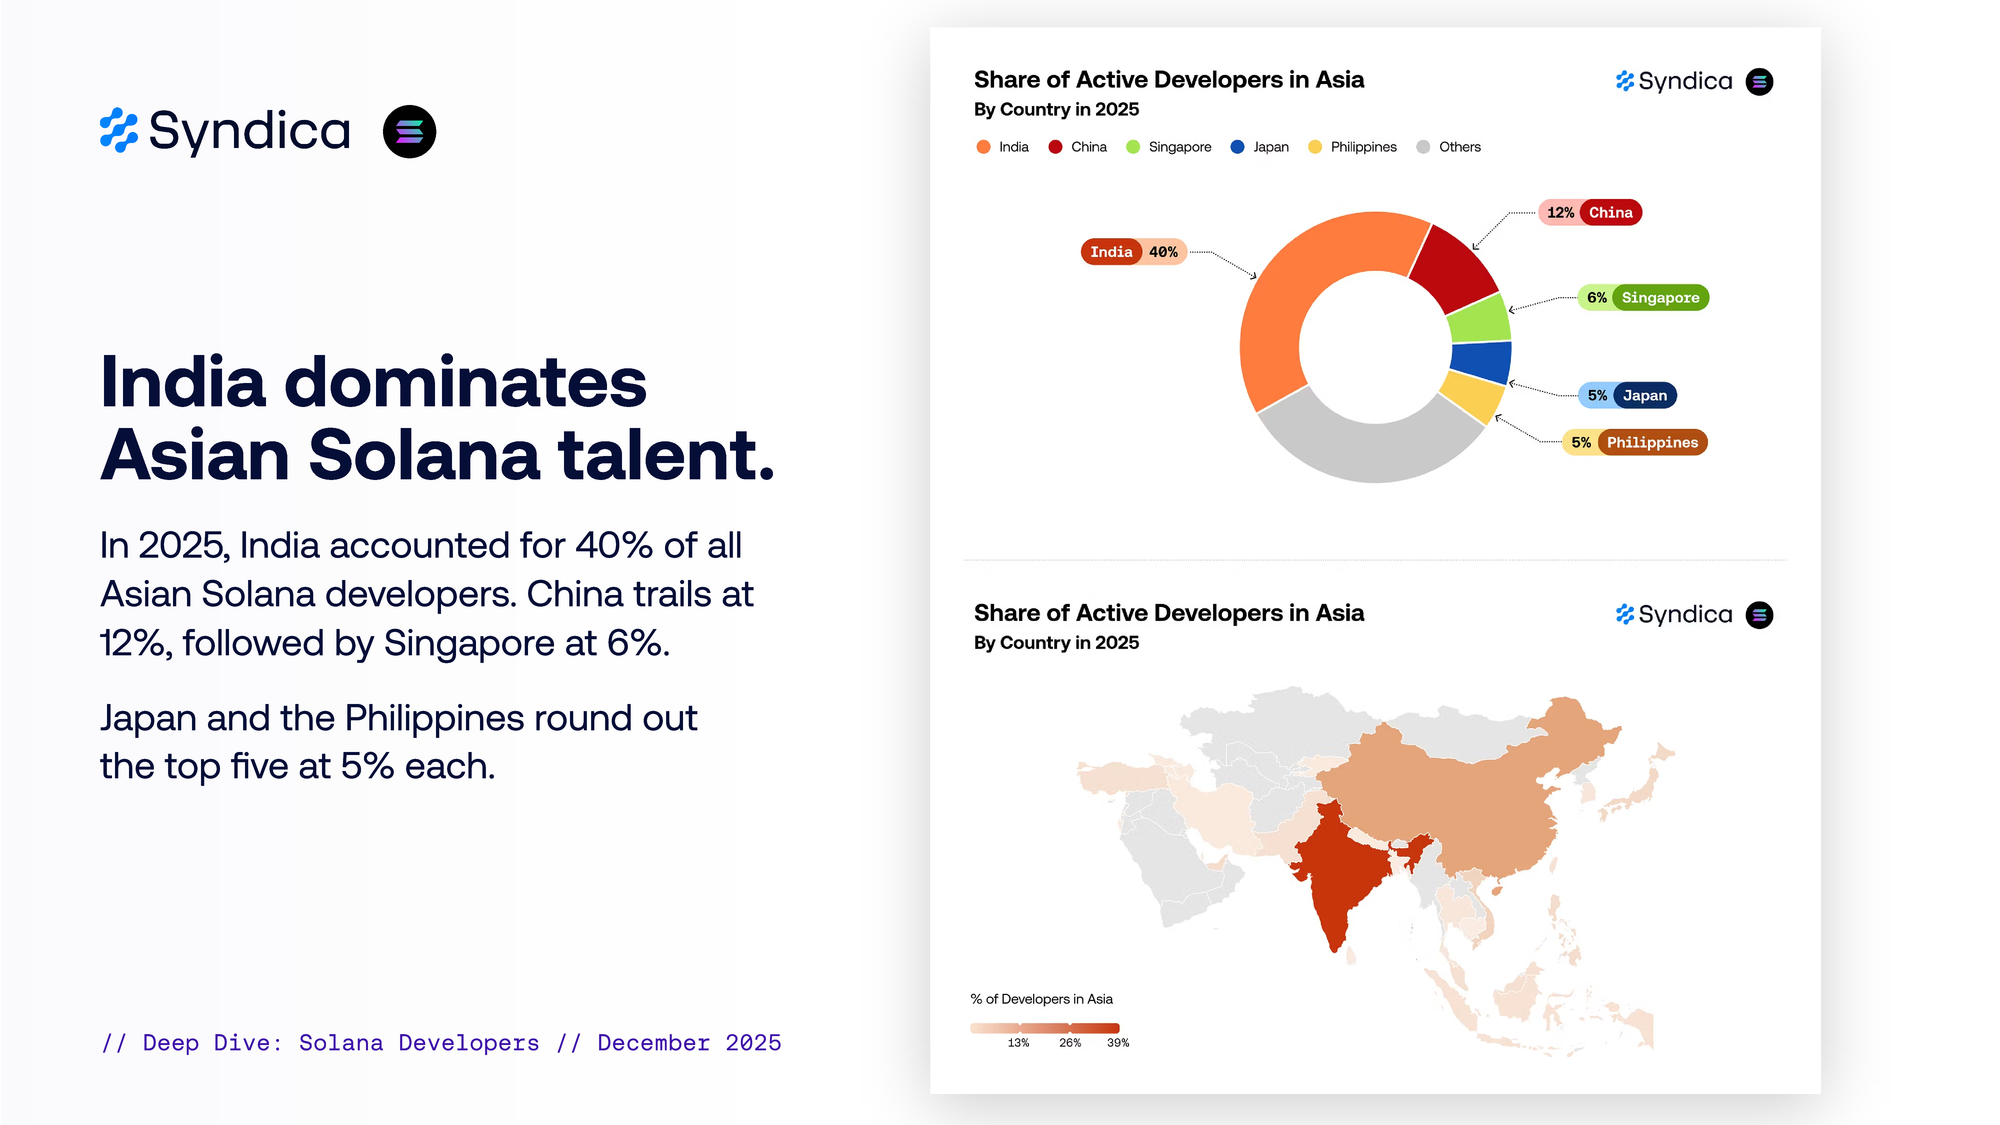
India dominates Asian Solana talent.
In 2025, India accounted for 40% of all Asian Solana developers. China trails at 12%, followed by Singapore at 6%.
Japan and the Philippines round out the top five at 5% each.
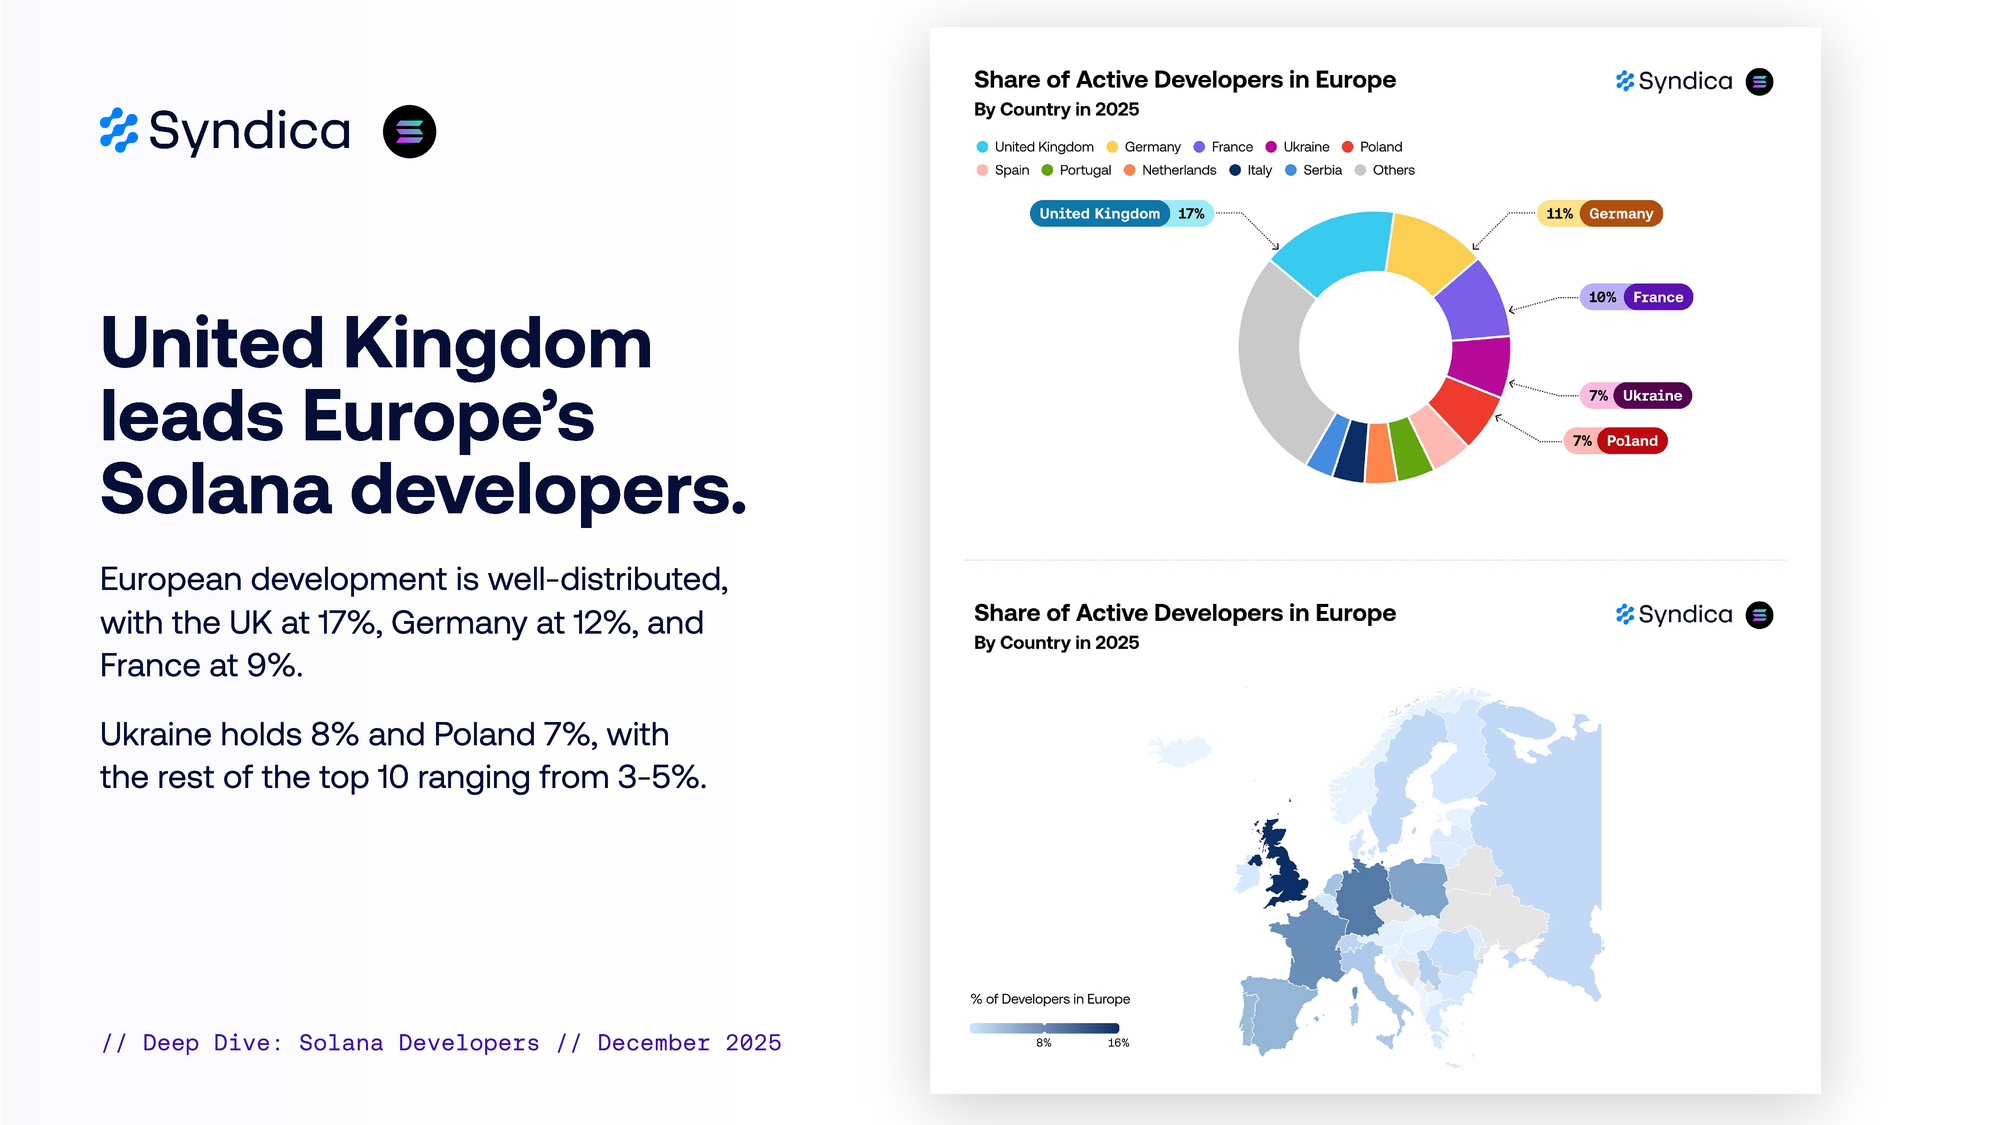
United Kingdom leads Europe’s Solana developers.
European development is well-distributed, with the UK at 17%, Germany at 12%, and France at 9%.
Ukraine holds 8% and Poland 7%, with the rest of the top 10 ranging from 3-5%.
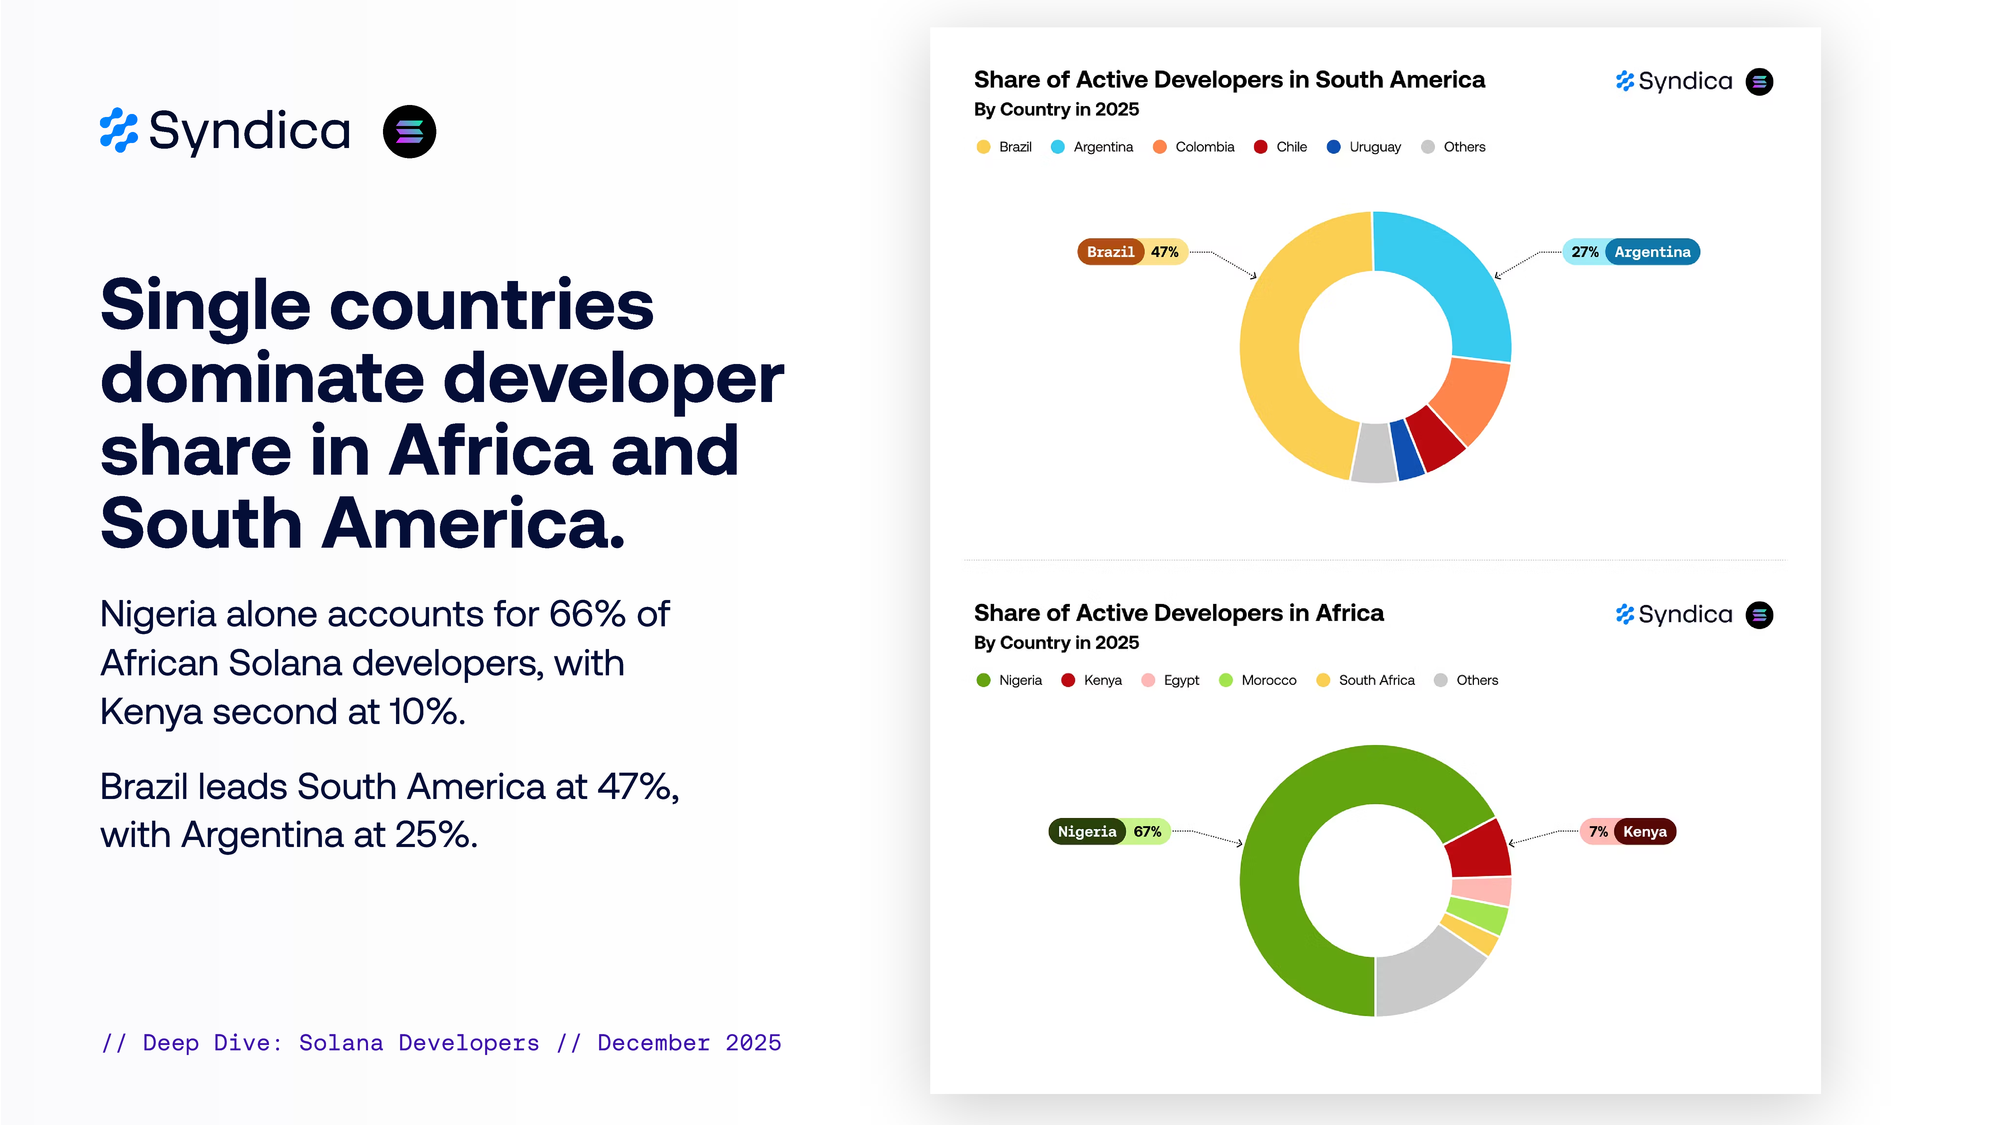
Single countries dominate developer share in Africa and South America.
Nigeria alone accounts for 66% of African Solana developers, with Kenya second at 10%.
Brazil leads South America at 47%, with Argentina at 25%.
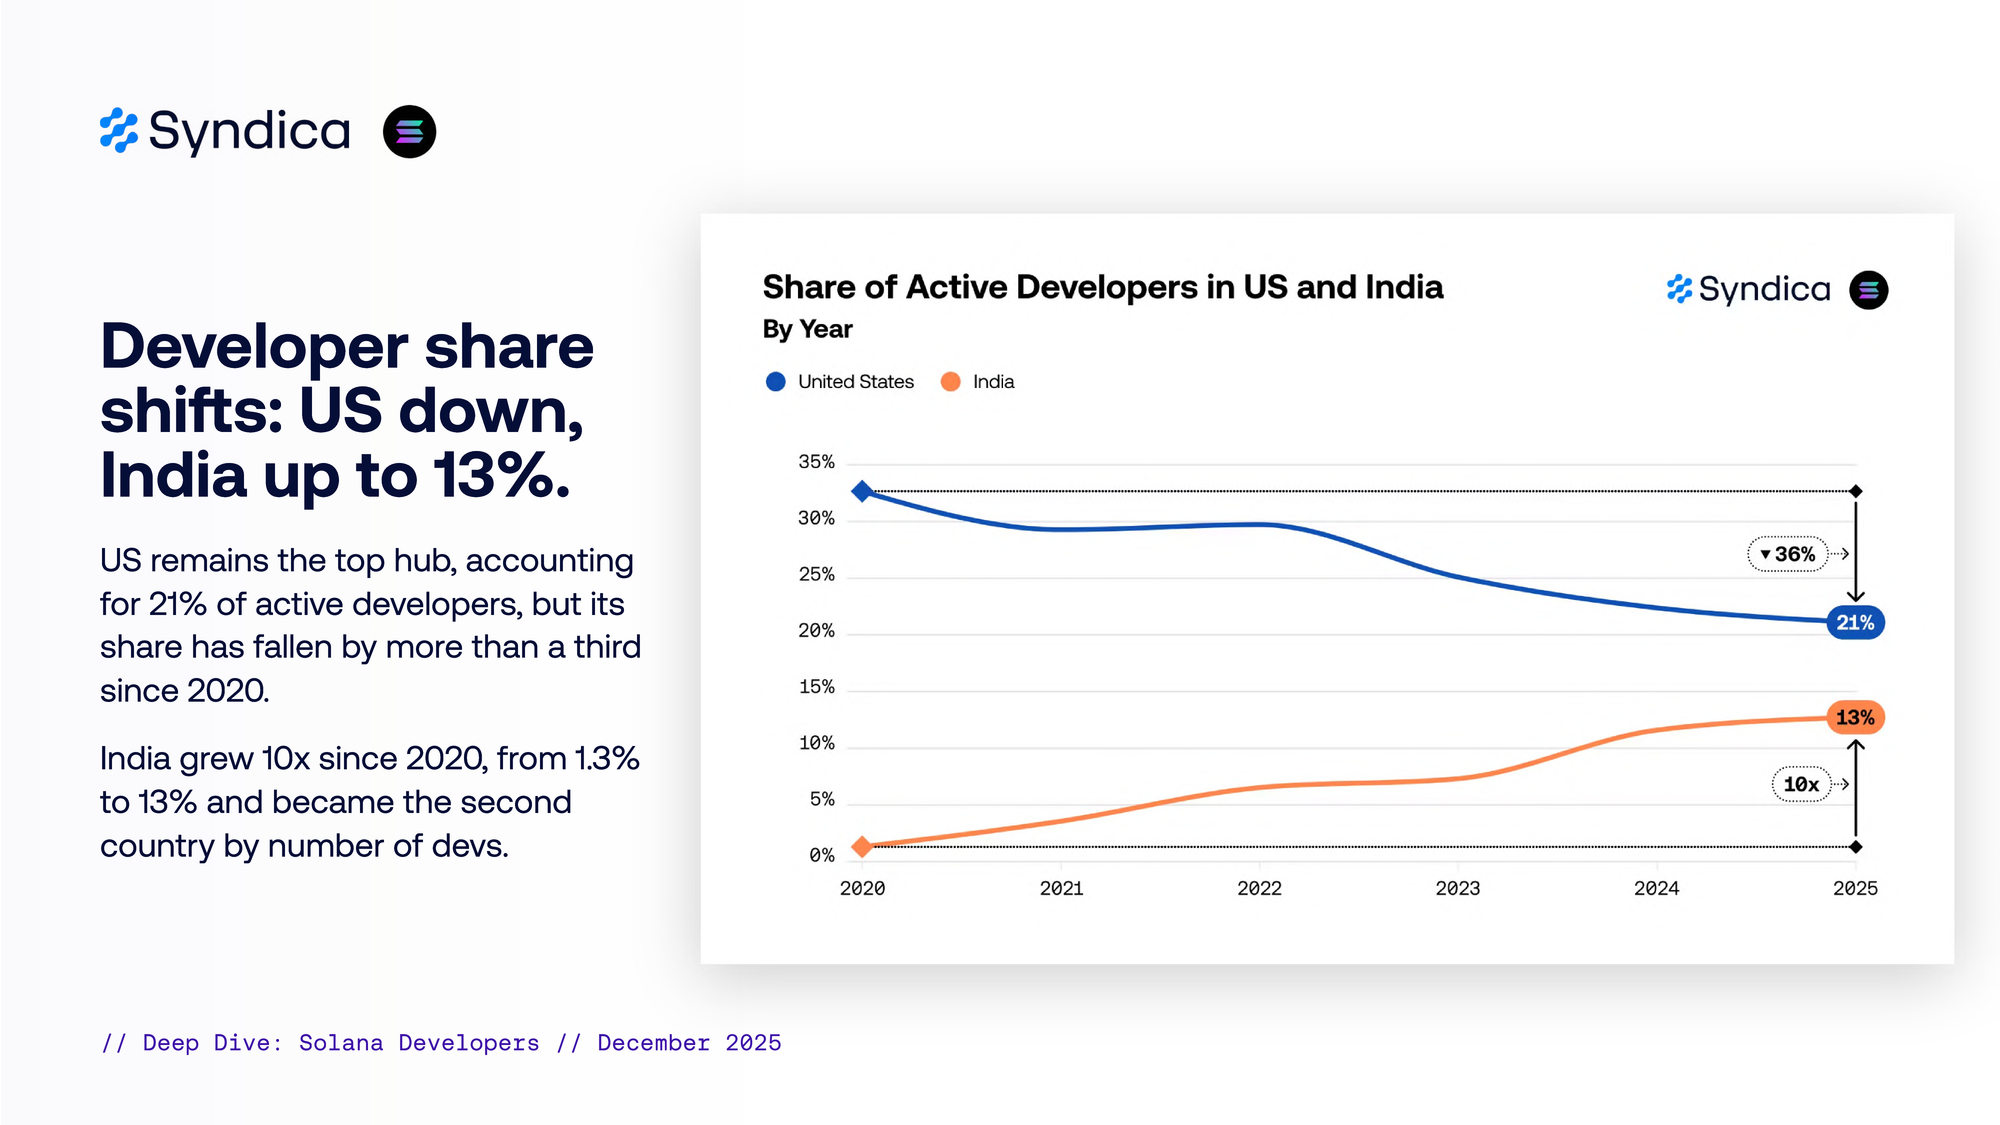
Developer share shifts: US down, India up to 13%.
US remains the top hub, accounting for 21% of active developers, but its share has fallen by more than a third since 2020.
India grew 10x since 2020, from 1.3% to 13% and became the second country by number of devs.
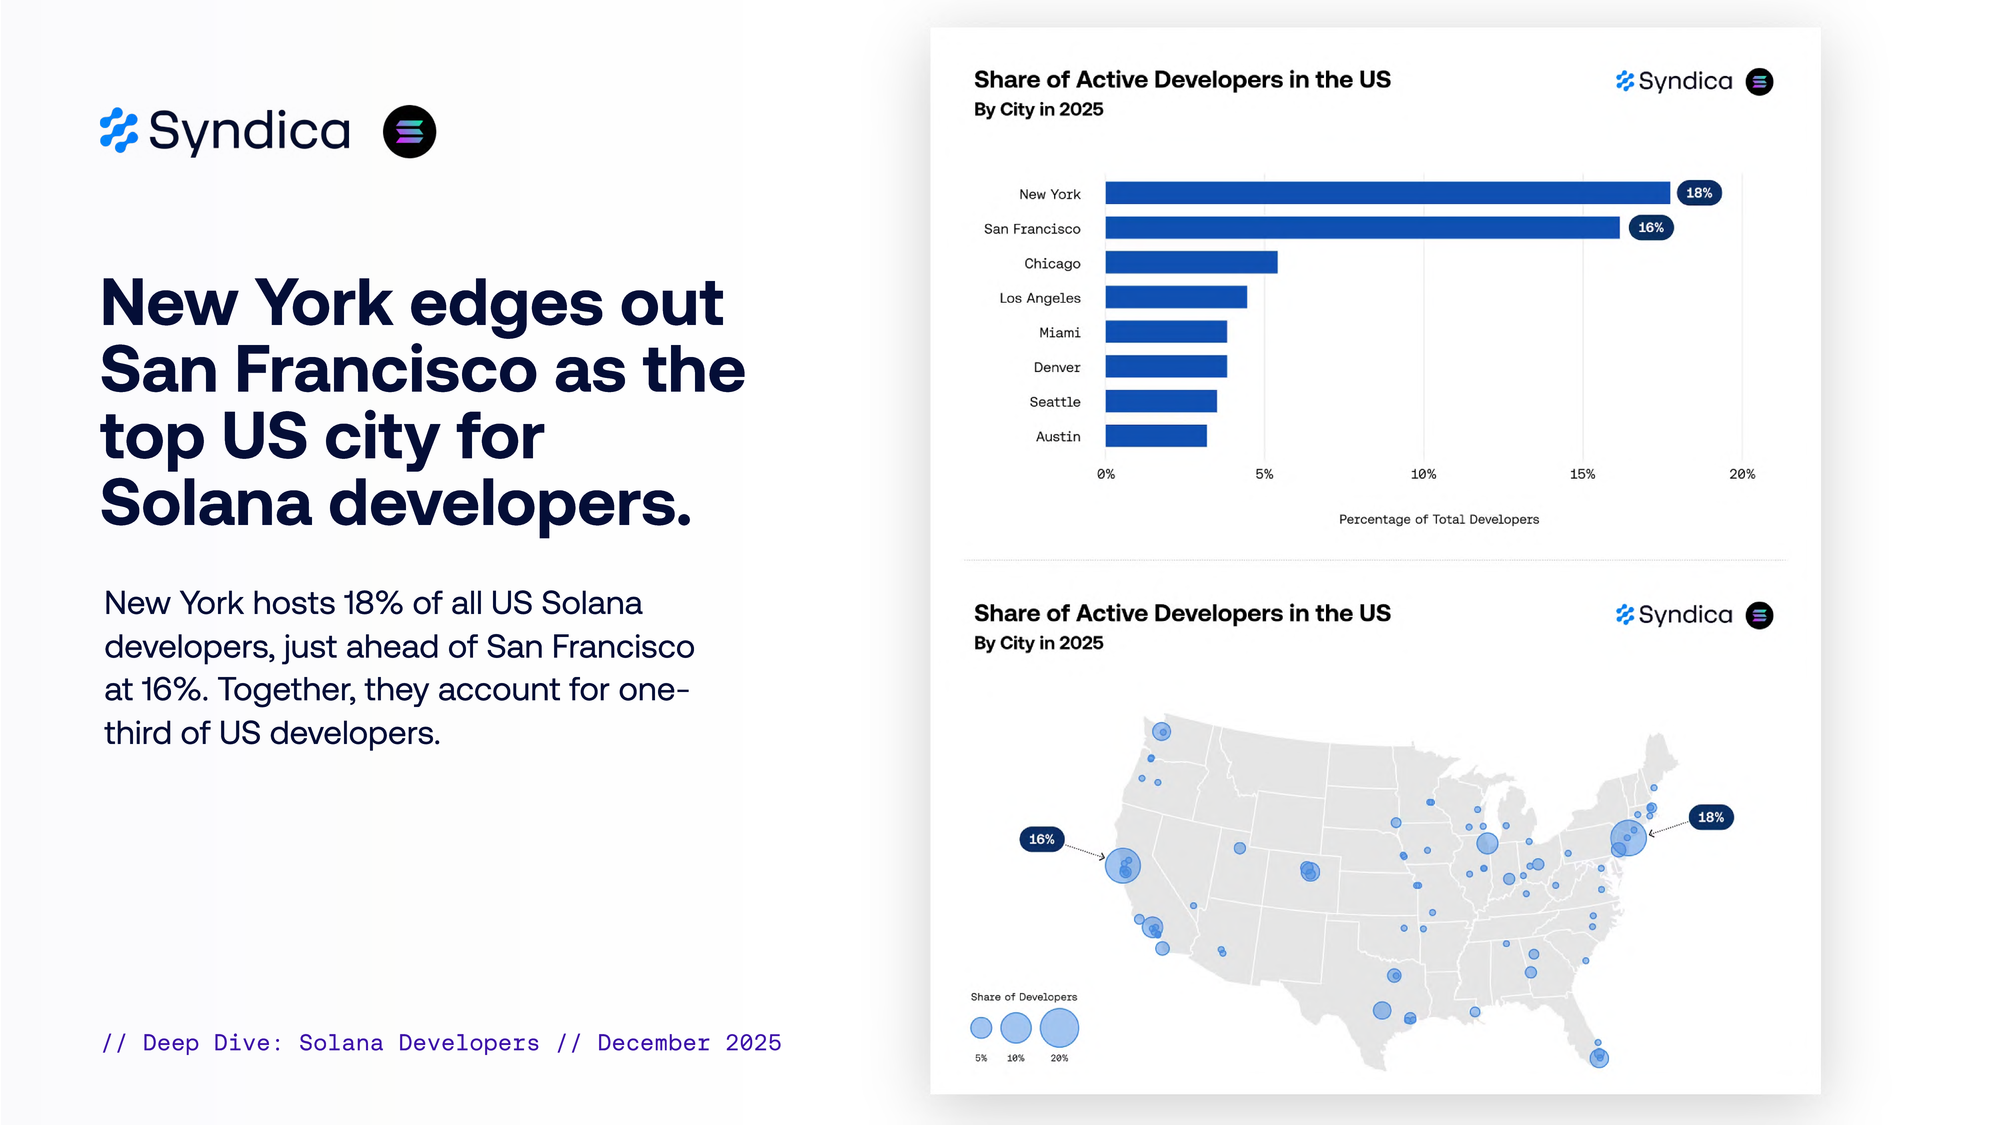
New York edges out San Francisco as the top US city for Solana developers.
New York hosts 18% of all US Solana developers, just ahead of San Francisco at 16%. Together, they account for one-third of US developers.
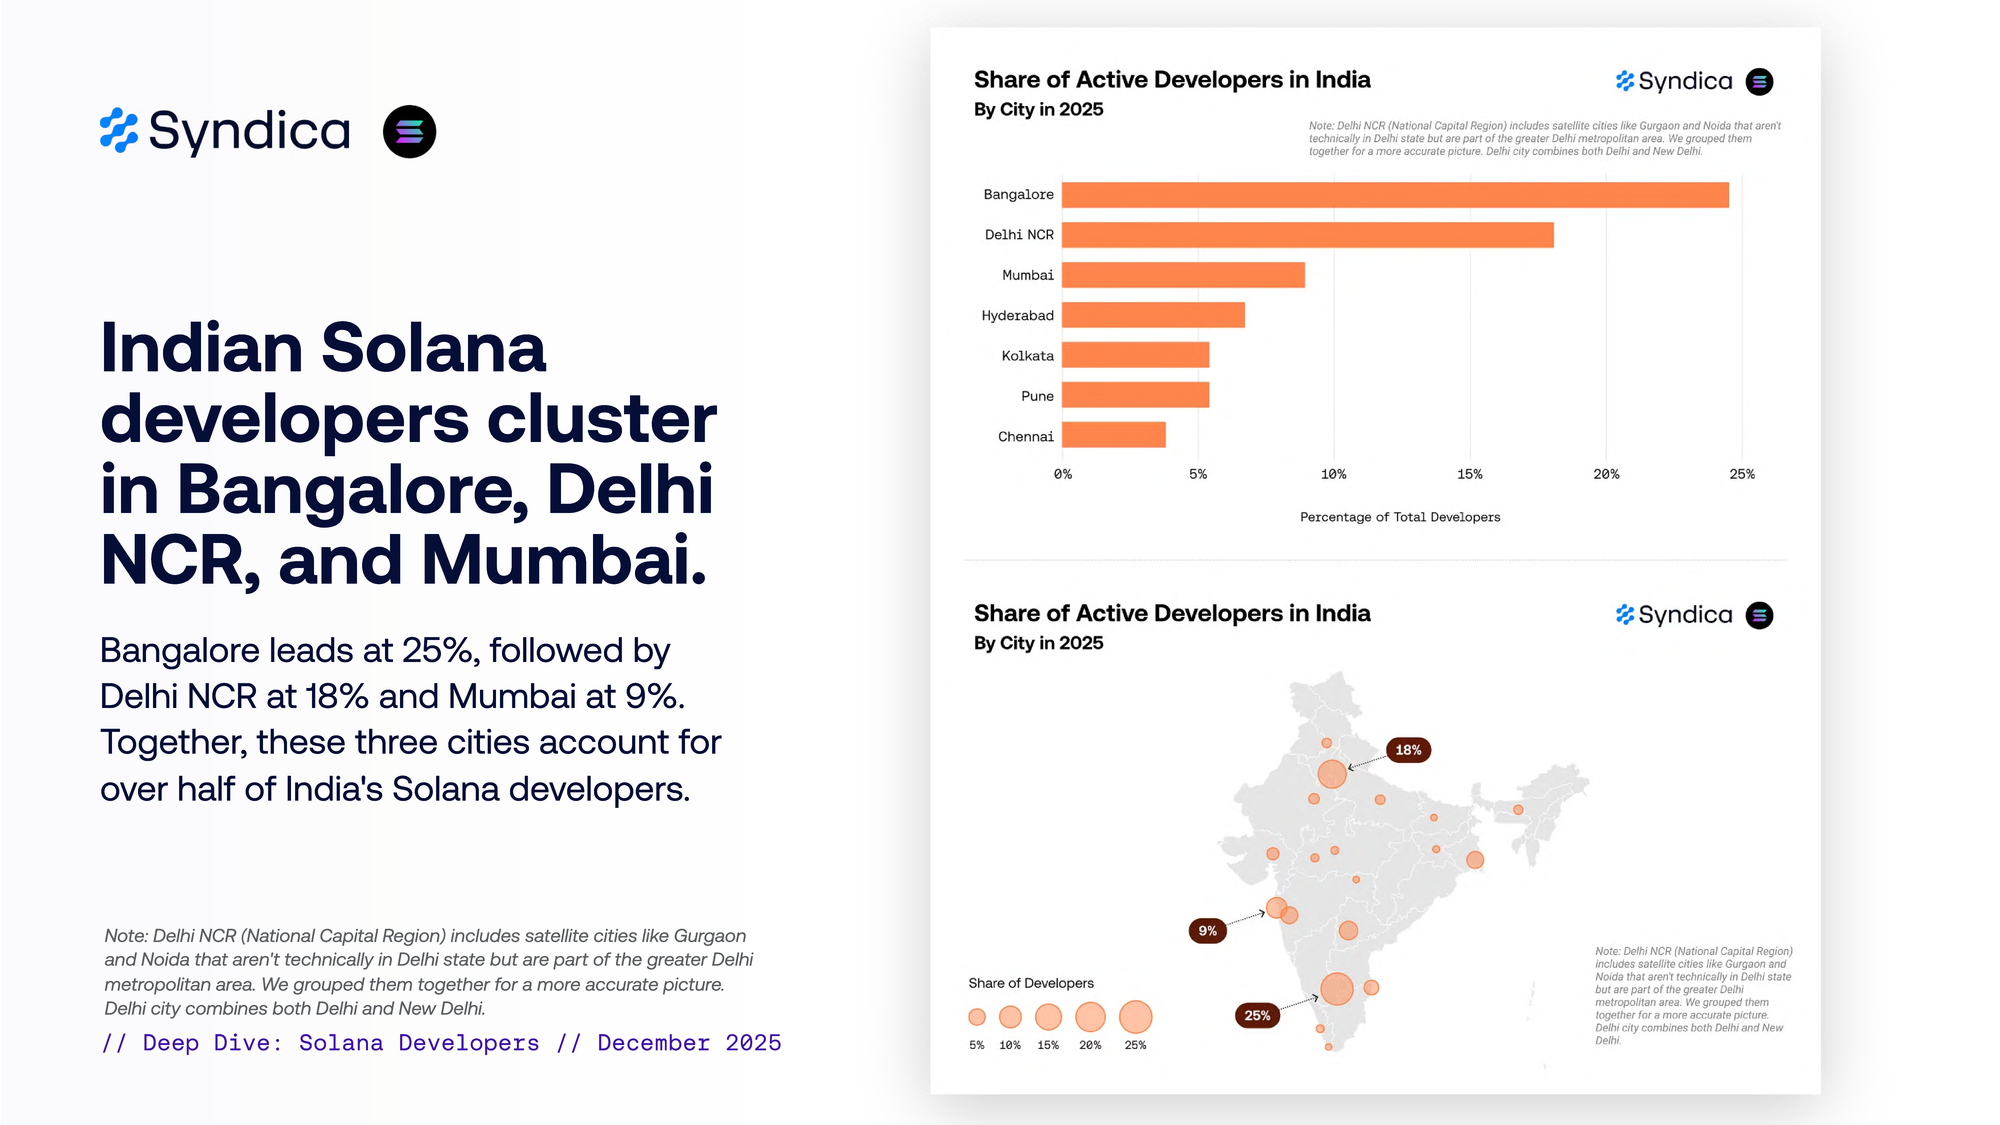
Indian Solana developers cluster in Bangalore, Delhi NCR, and Mumbai.
Bangalore leads at 23%, followed by Delhi NCR at 17% and Mumbai at 14%. Together, these three cities account for over half of India’s Solana developers.
Note: Delhi NCR (National Capital Region) includes satellite cities like Gurgaon and Noida that aren’t technically in Delhi state but are part of the greater Delhi metropolitan area. We grouped them together for a more accurate picture. Delhi city combines both Delhi and New Delhi.
Part IV
Geography: Professional Developers
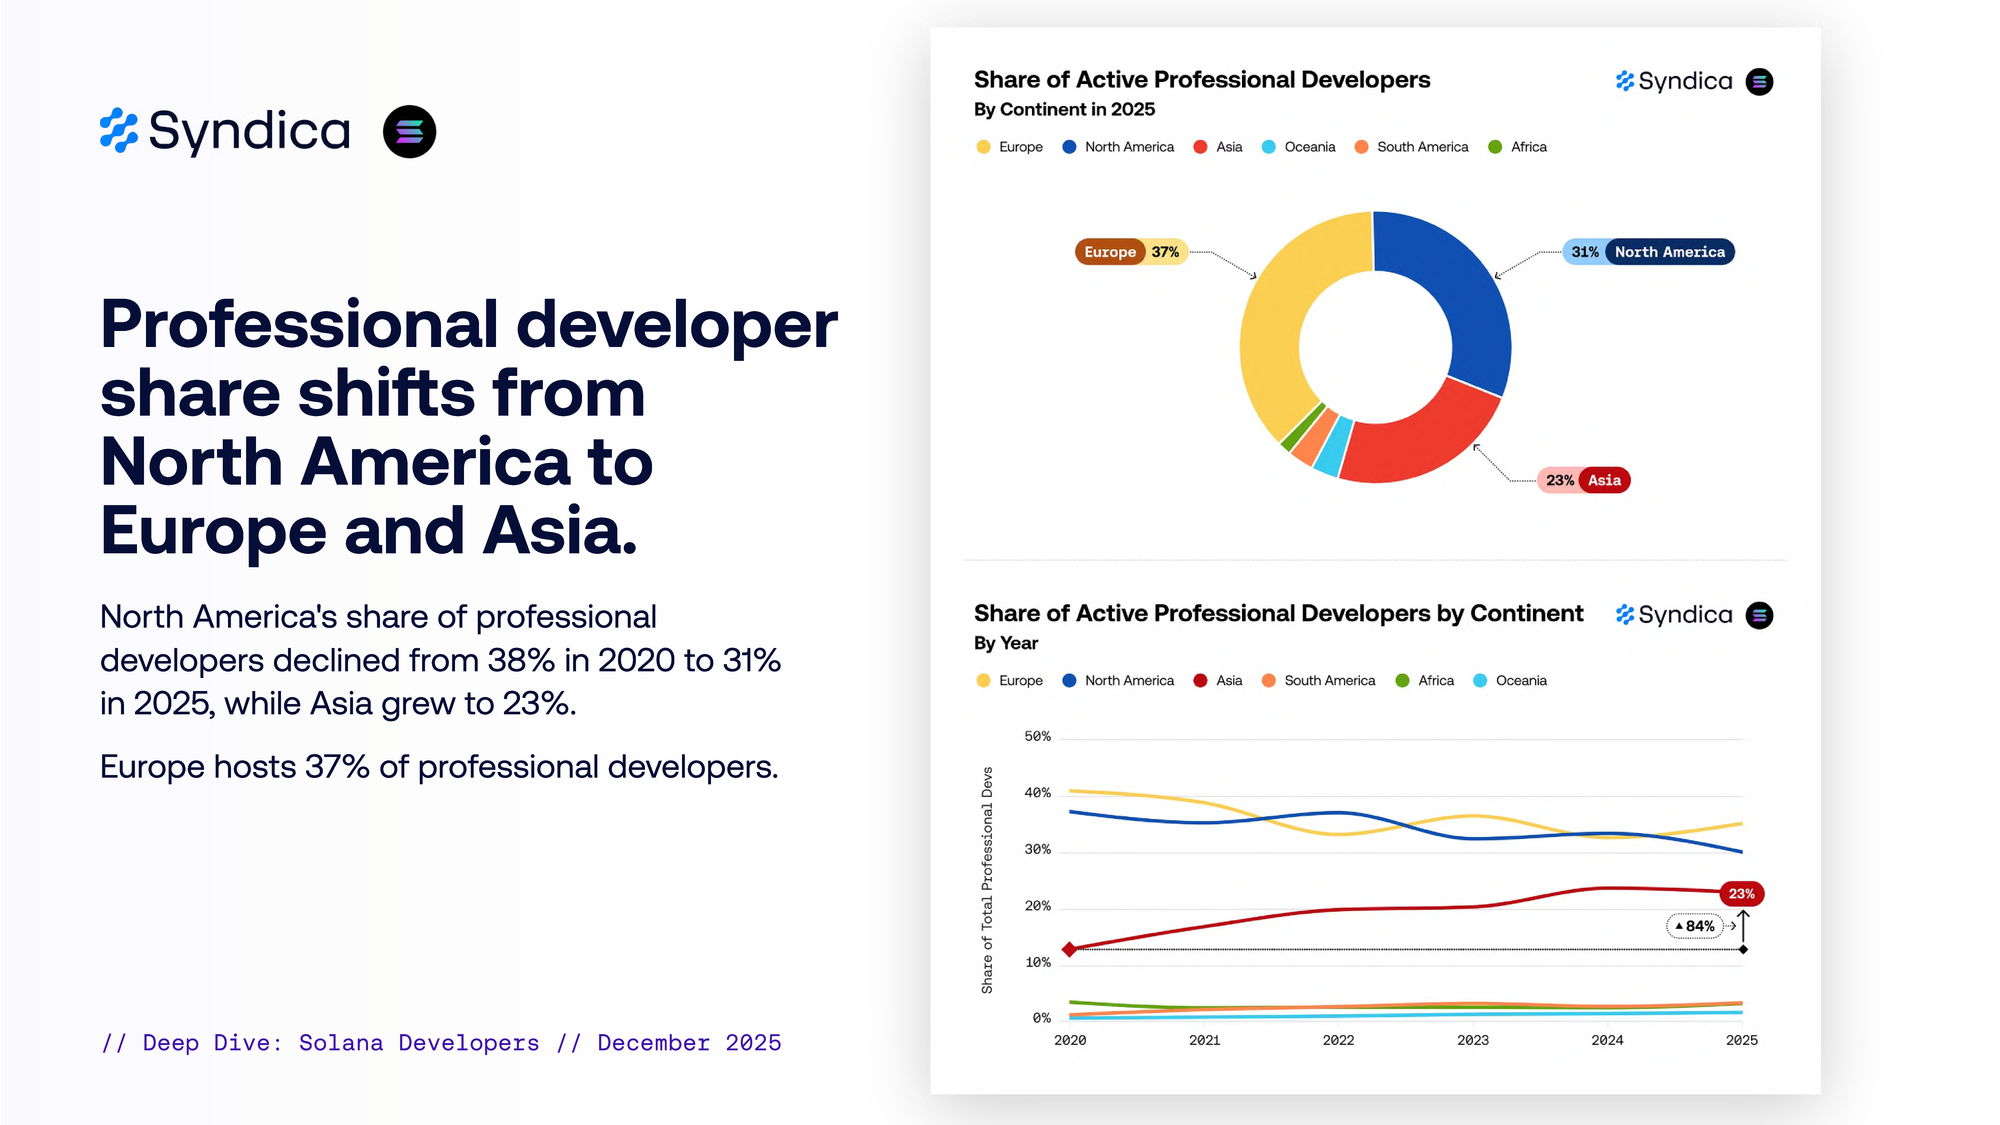
Professional developer share shifts from North America to Europe and Asia.
North America’s share of professional developers declined from 48% in 2020 to 33% in 2025, while Asia grew to 21%.
Europe overtook North America in 2023 and now hosts 38% of professional developers.
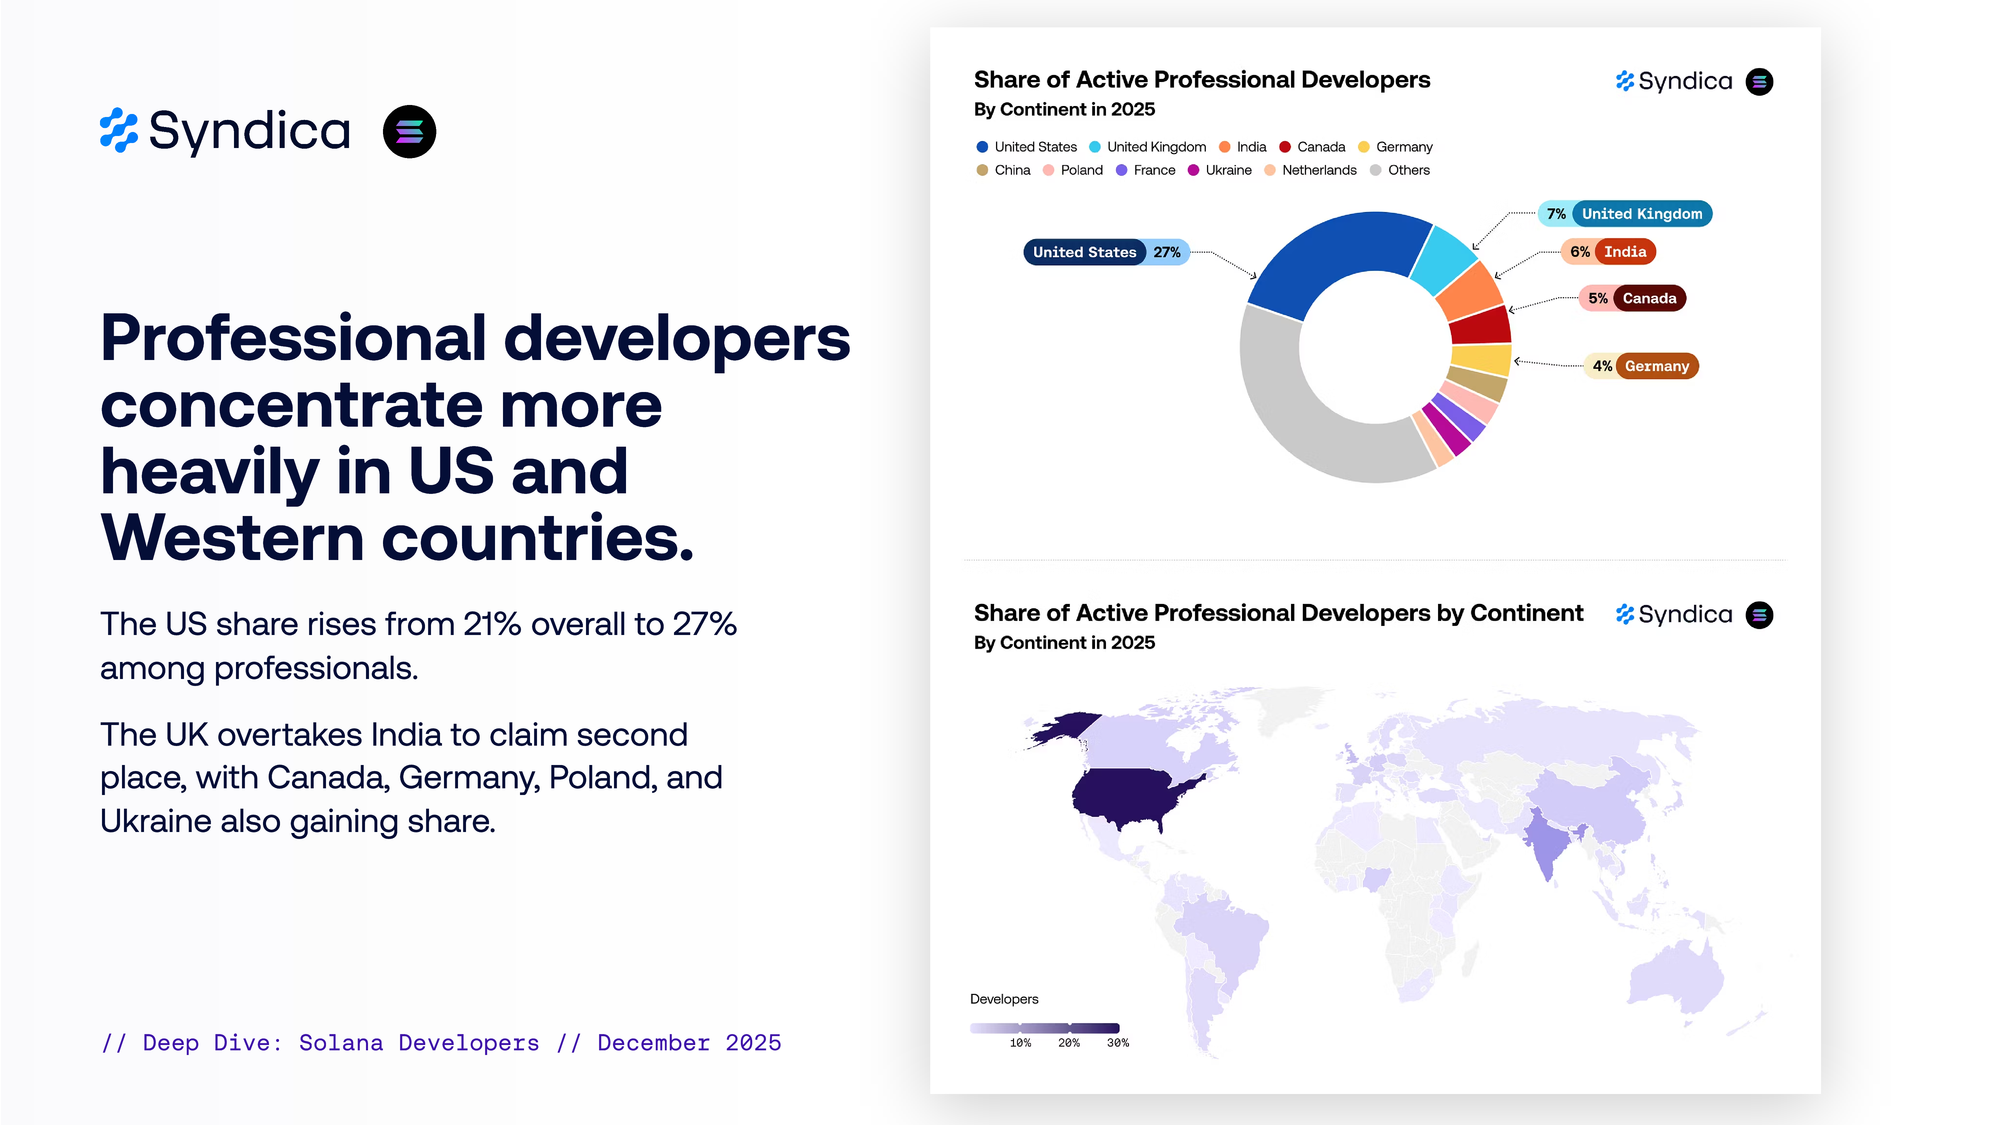
Professional developers concentrate more heavily in US and Western countries.
The US share rises from 21% overall to 27% among professionals.
The UK overtakes India to claim second place, with Canada, Germany, Poland, and Ukraine also gaining share.