Deep Dive: Solana Onchain Activity - October 2025
Deep Dive: Solana Onchain Activity - October 2025


Note: Below is the text-accessible version of this post for visually impaired readers.
Syndica Deep Dive: Solana Onchain Activity - October 2025
Real Economic Value dropped 92% from January to October. REV (transaction fees and tips for transaction inclusion) dropped from 2.8M SOL in January to 232K SOL in October. As network activity waned, tips fell from 60% to 41% of revenue.
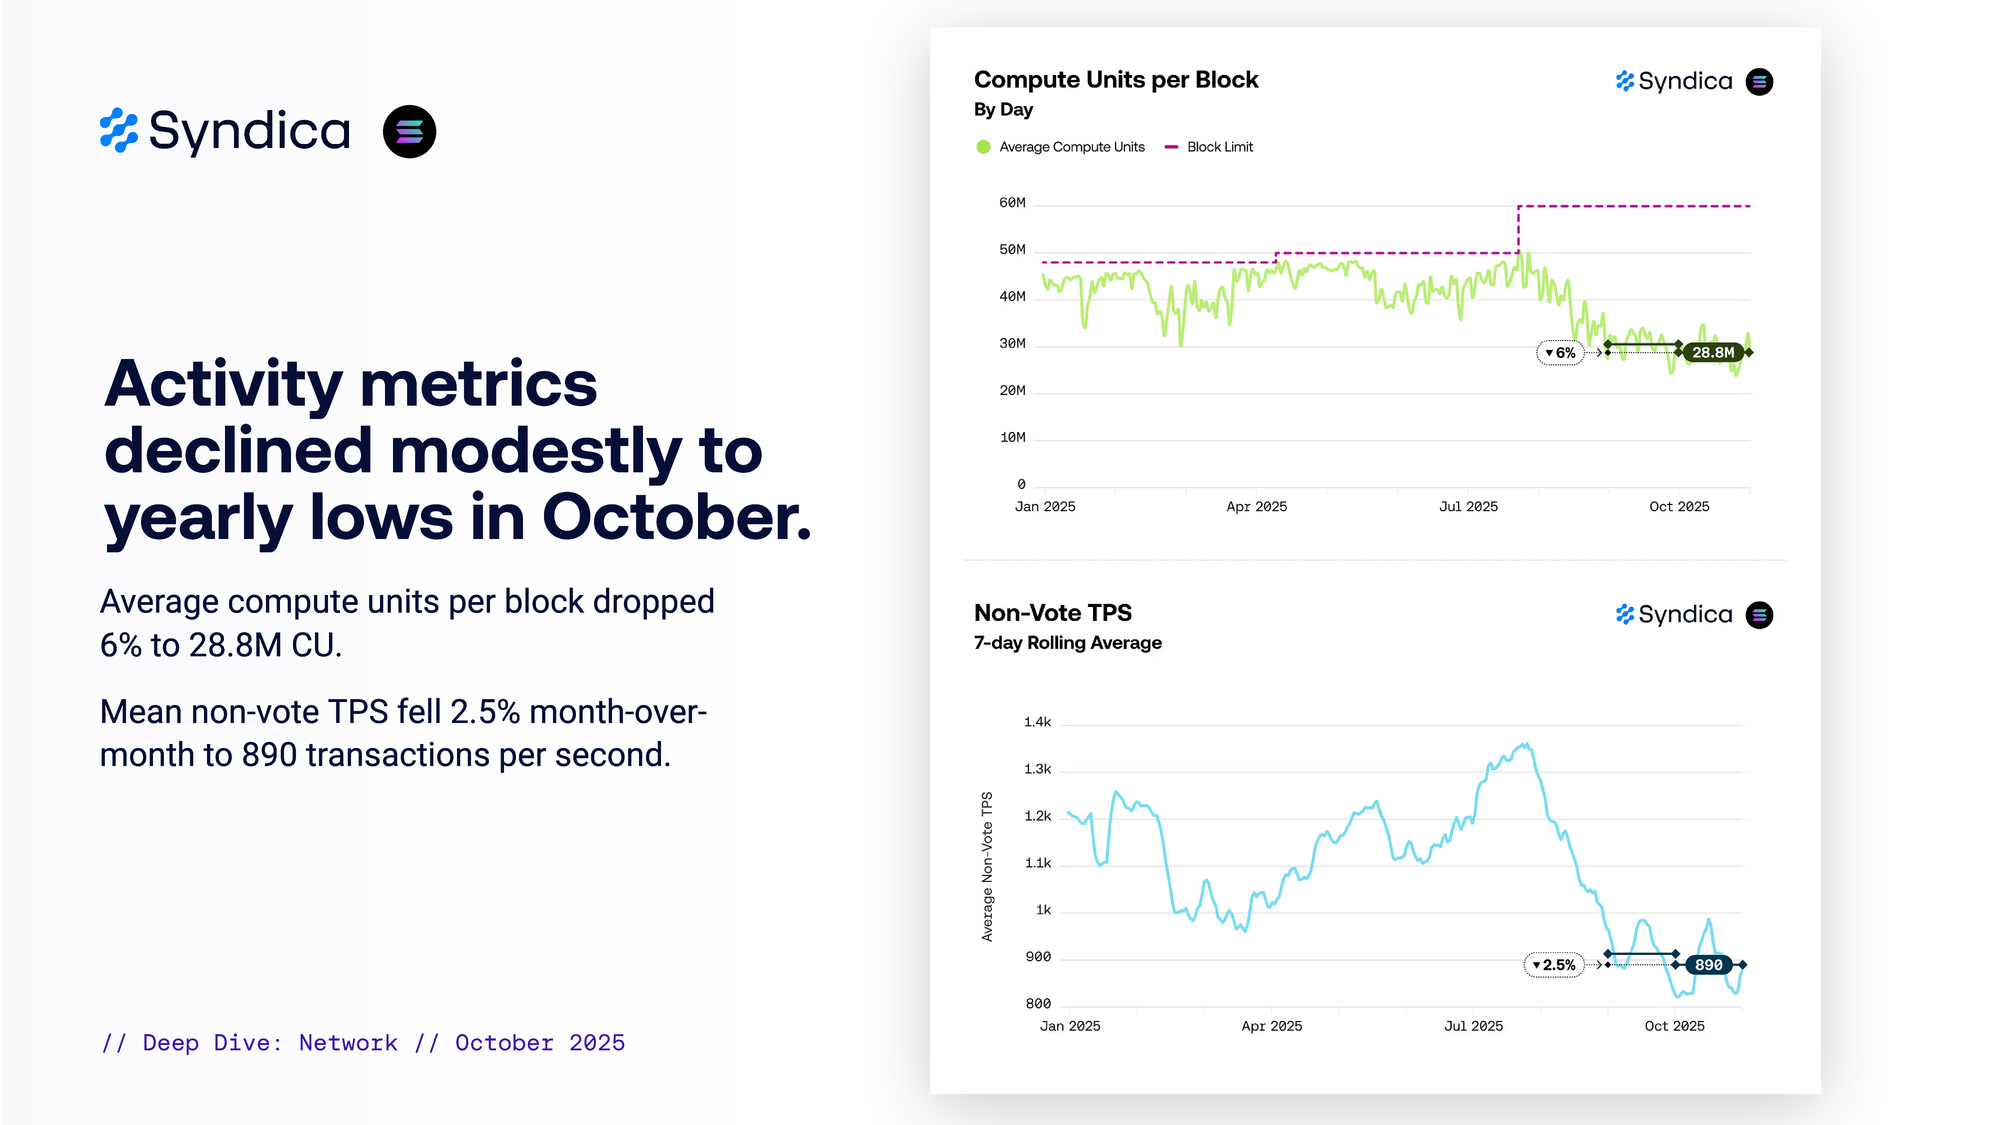
Activity metrics declined modestly to yearly lows in October. Average compute units per block dropped 6% to 28.8M CU. Mean non-vote TPS fell 2.5% month-over-month to 890 transactions per second.
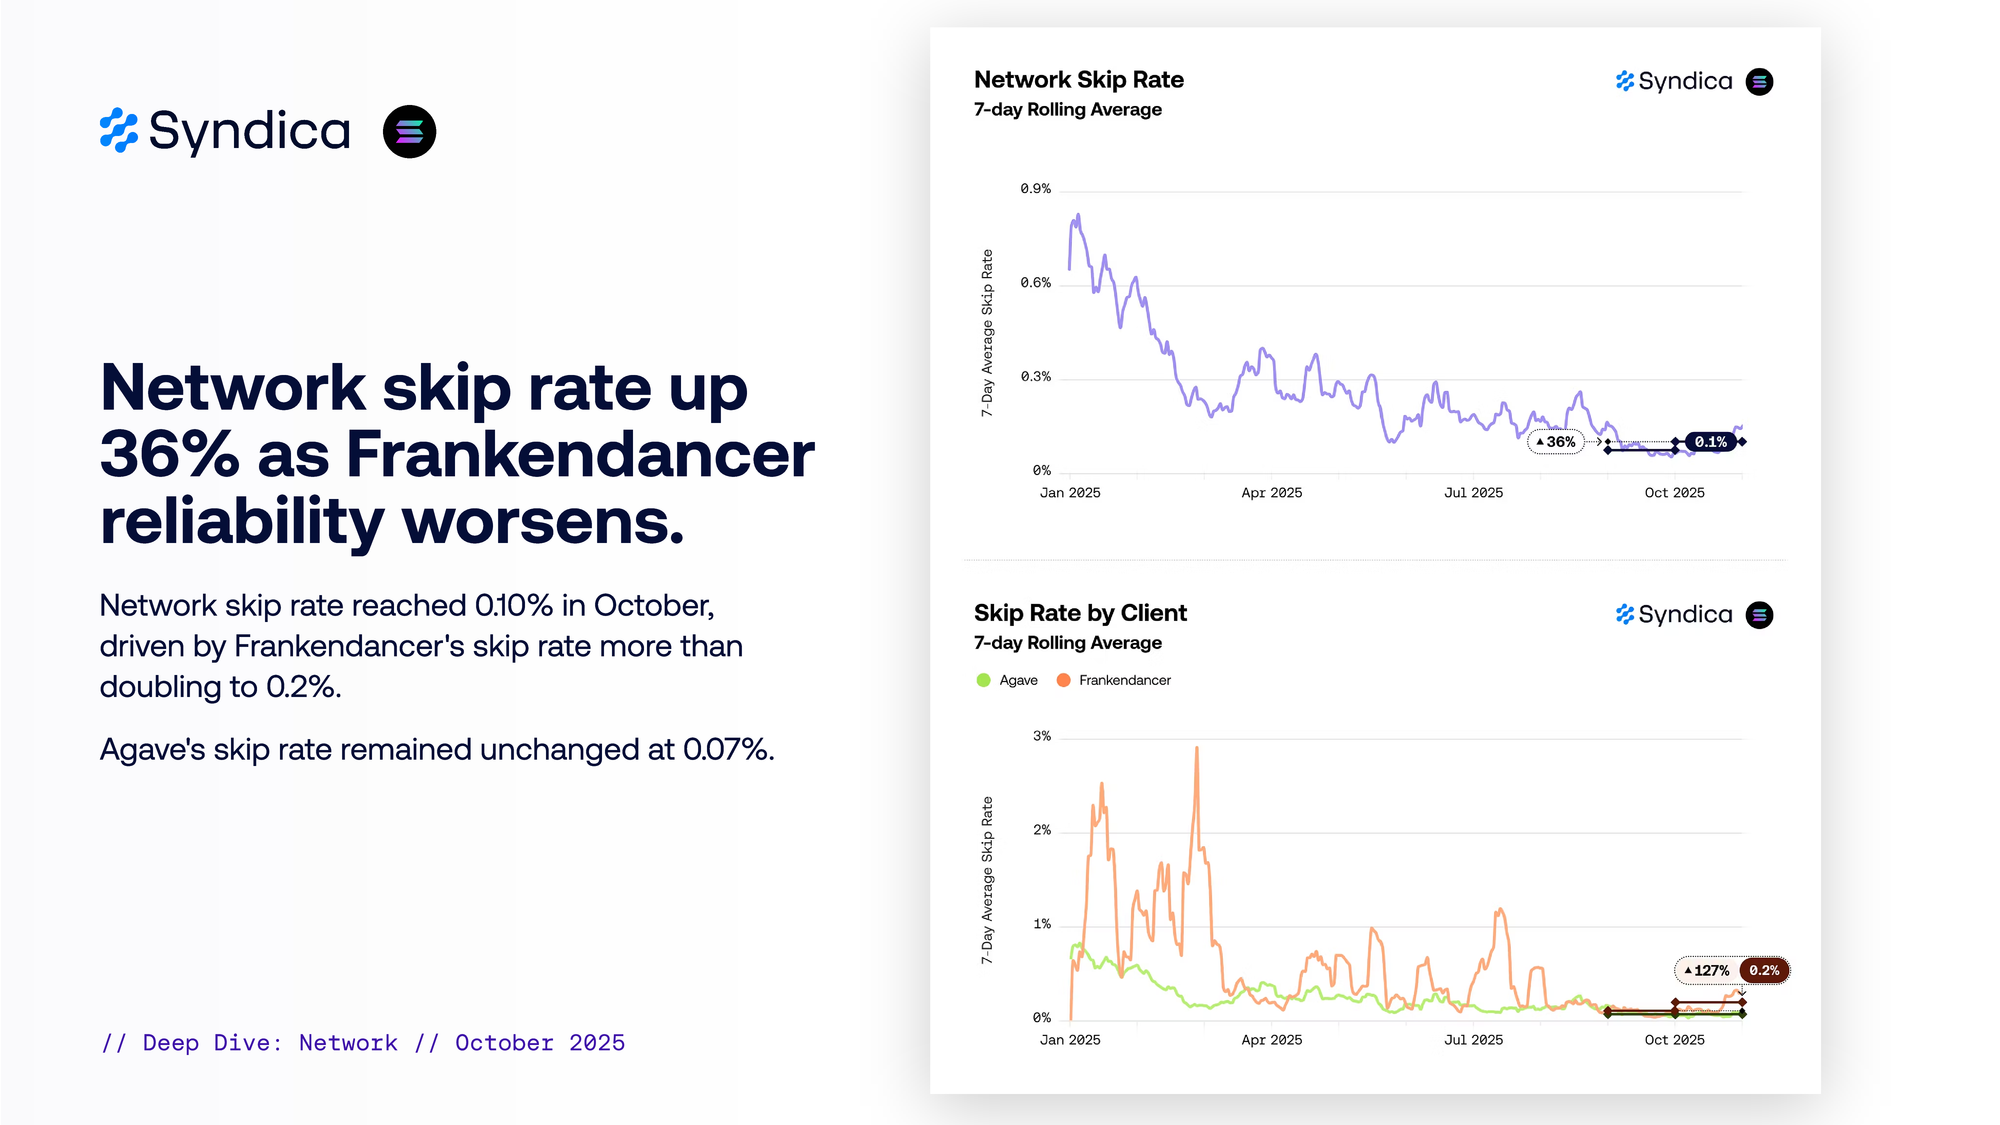
Network skip rate up 36% as Frankendancer reliability worsened. Network skip rate reached 0.10% in October, driven by Frankendancer's skip rate more than doubling to 0.2%. Agave's skip rate remained unchanged at 0.07%.
P99 vote latency rose 11% to 1.32 slots in October. Despite the uptick, latency remained close to the ideal 1 slot target and is down 80% year-to-date. Frankendancer validators show 18% higher p99 vote latency in October, in line with the average gap maintained since July.
The median validator produced blocks at 375ms, 6% below target. 68% of validators produced blocks within 400ms in October. The fastest 10% of validators produced blocks in 358ms, and the slowest 10% in 429ms.
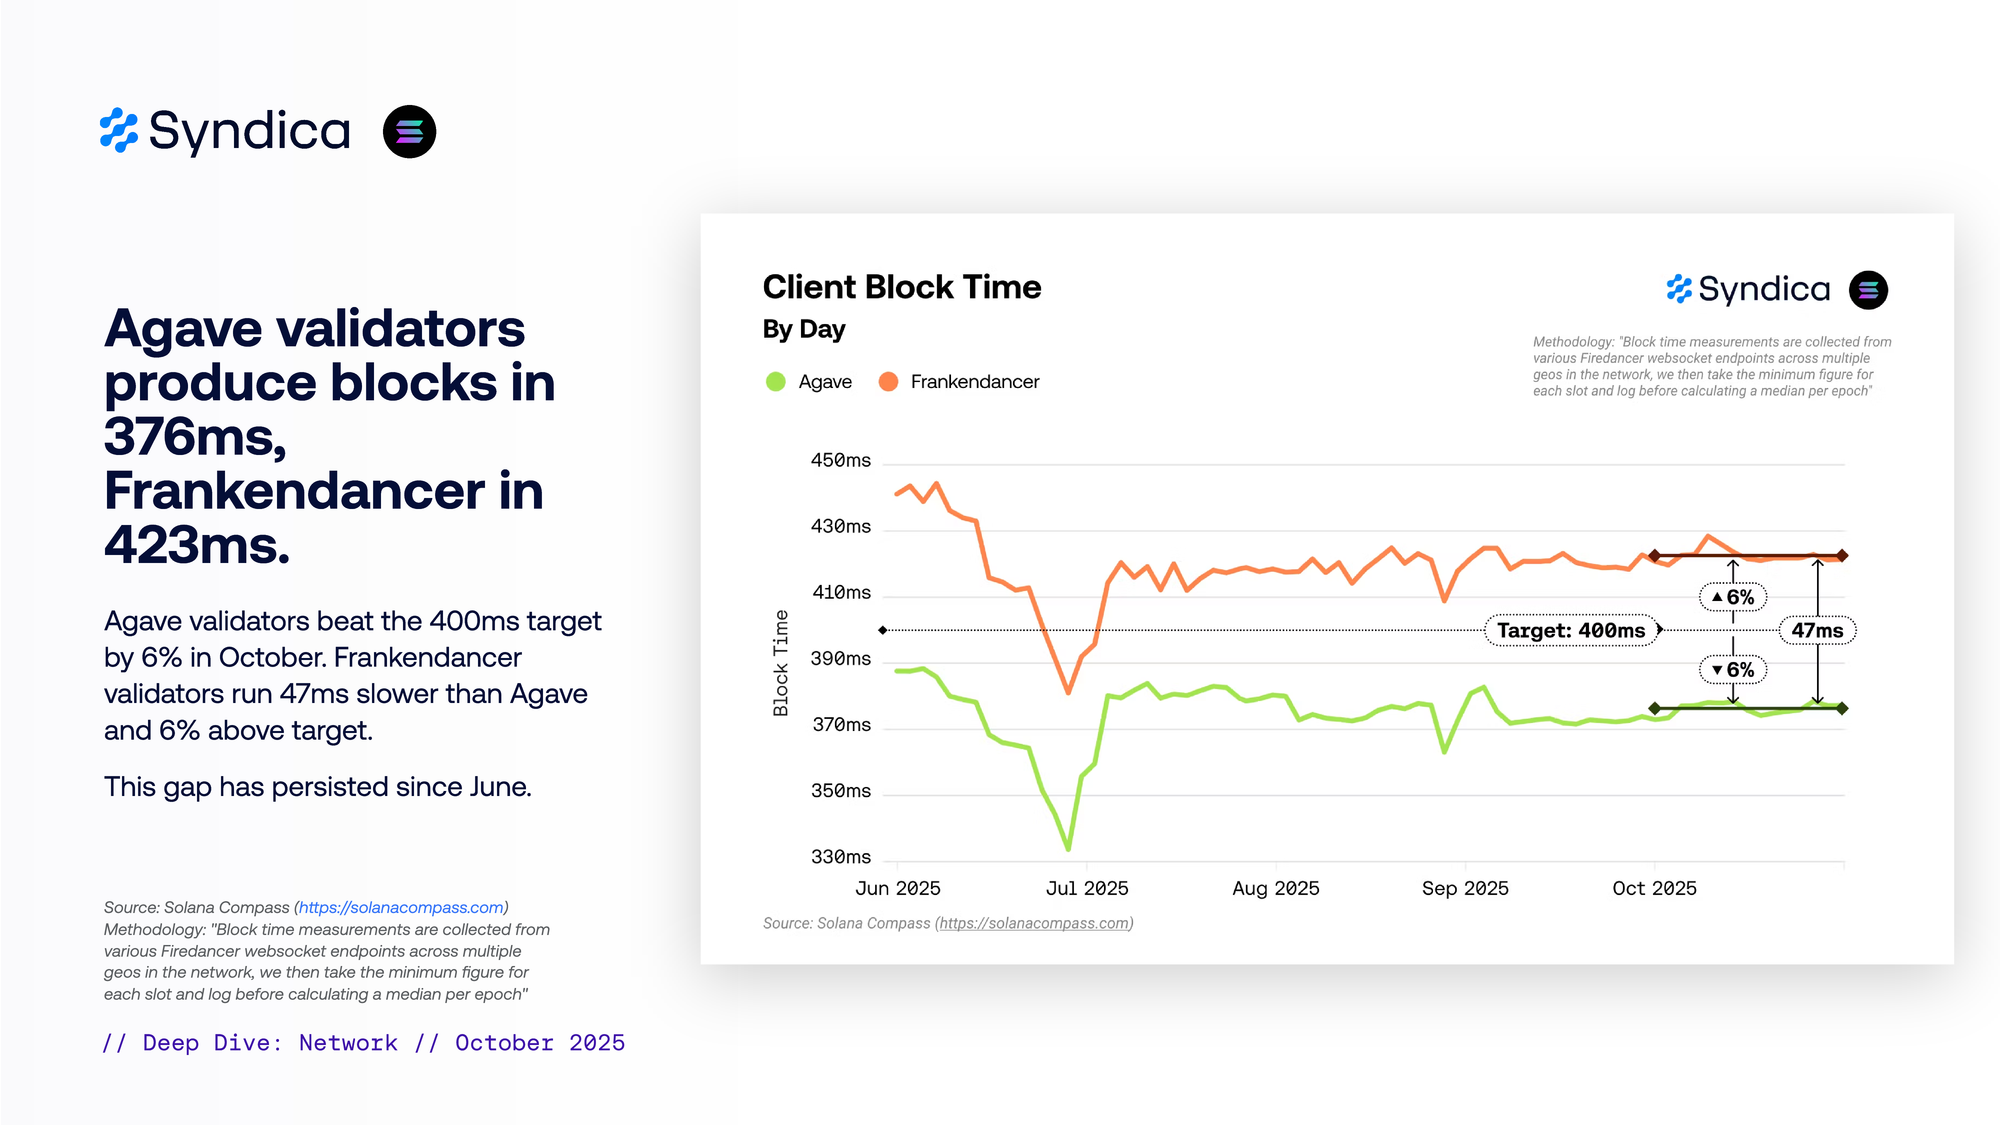
Agave validators produced blocks in 376ms, Frankendancer in 423ms. Agave validators beat the 400ms target by 6% in October. Frankendancer validators ran 47ms slower than Agave and 6% above target. This gap has persisted since June.
Part II - Frankendancer Premium
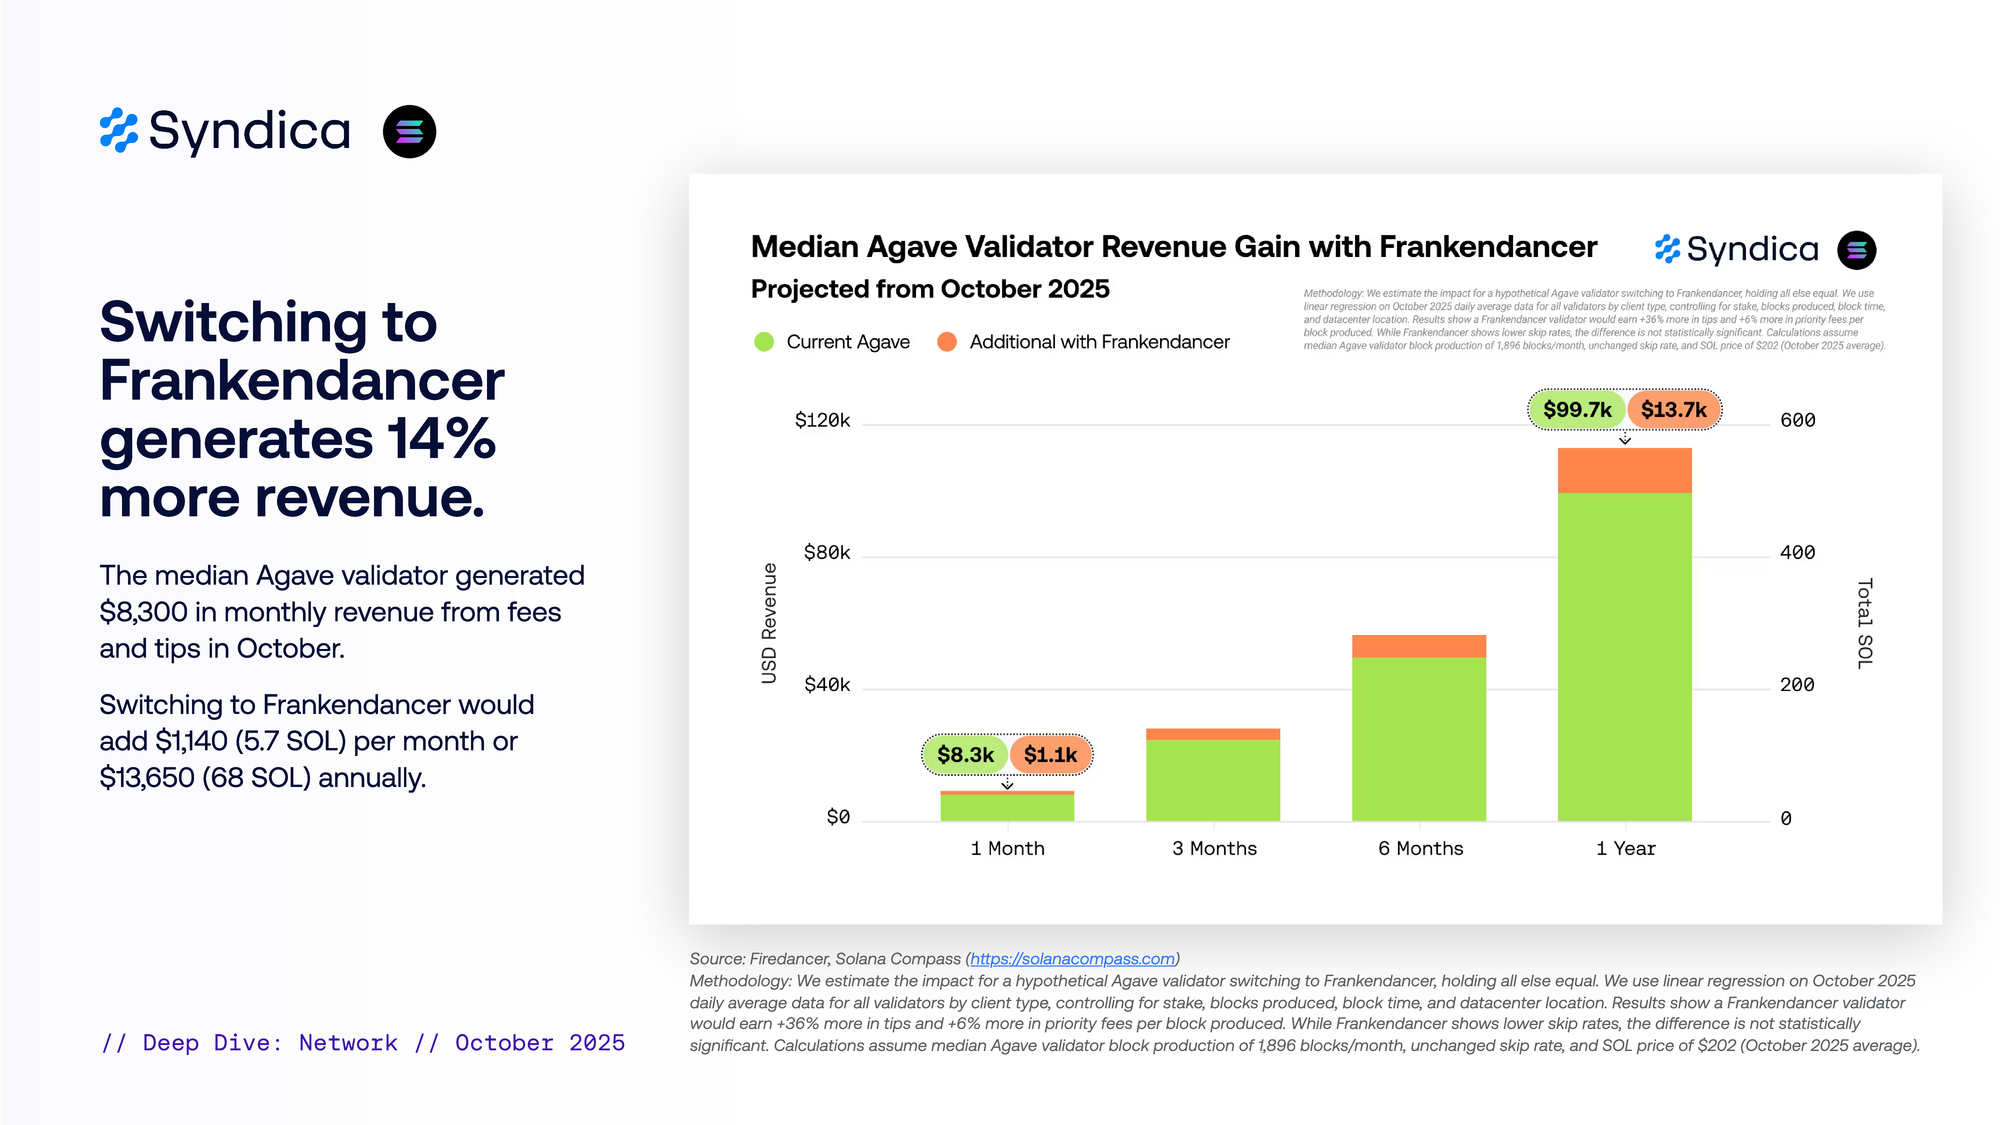
Switching to Frankendancer generated 14% more revenue. The median Agave validator generated $8,300 in monthly revenue from fees and tips in October. Switching to Frankendancer would add $1,140 (5.7 SOL) per month or $13,650 (68 SOL) annually.
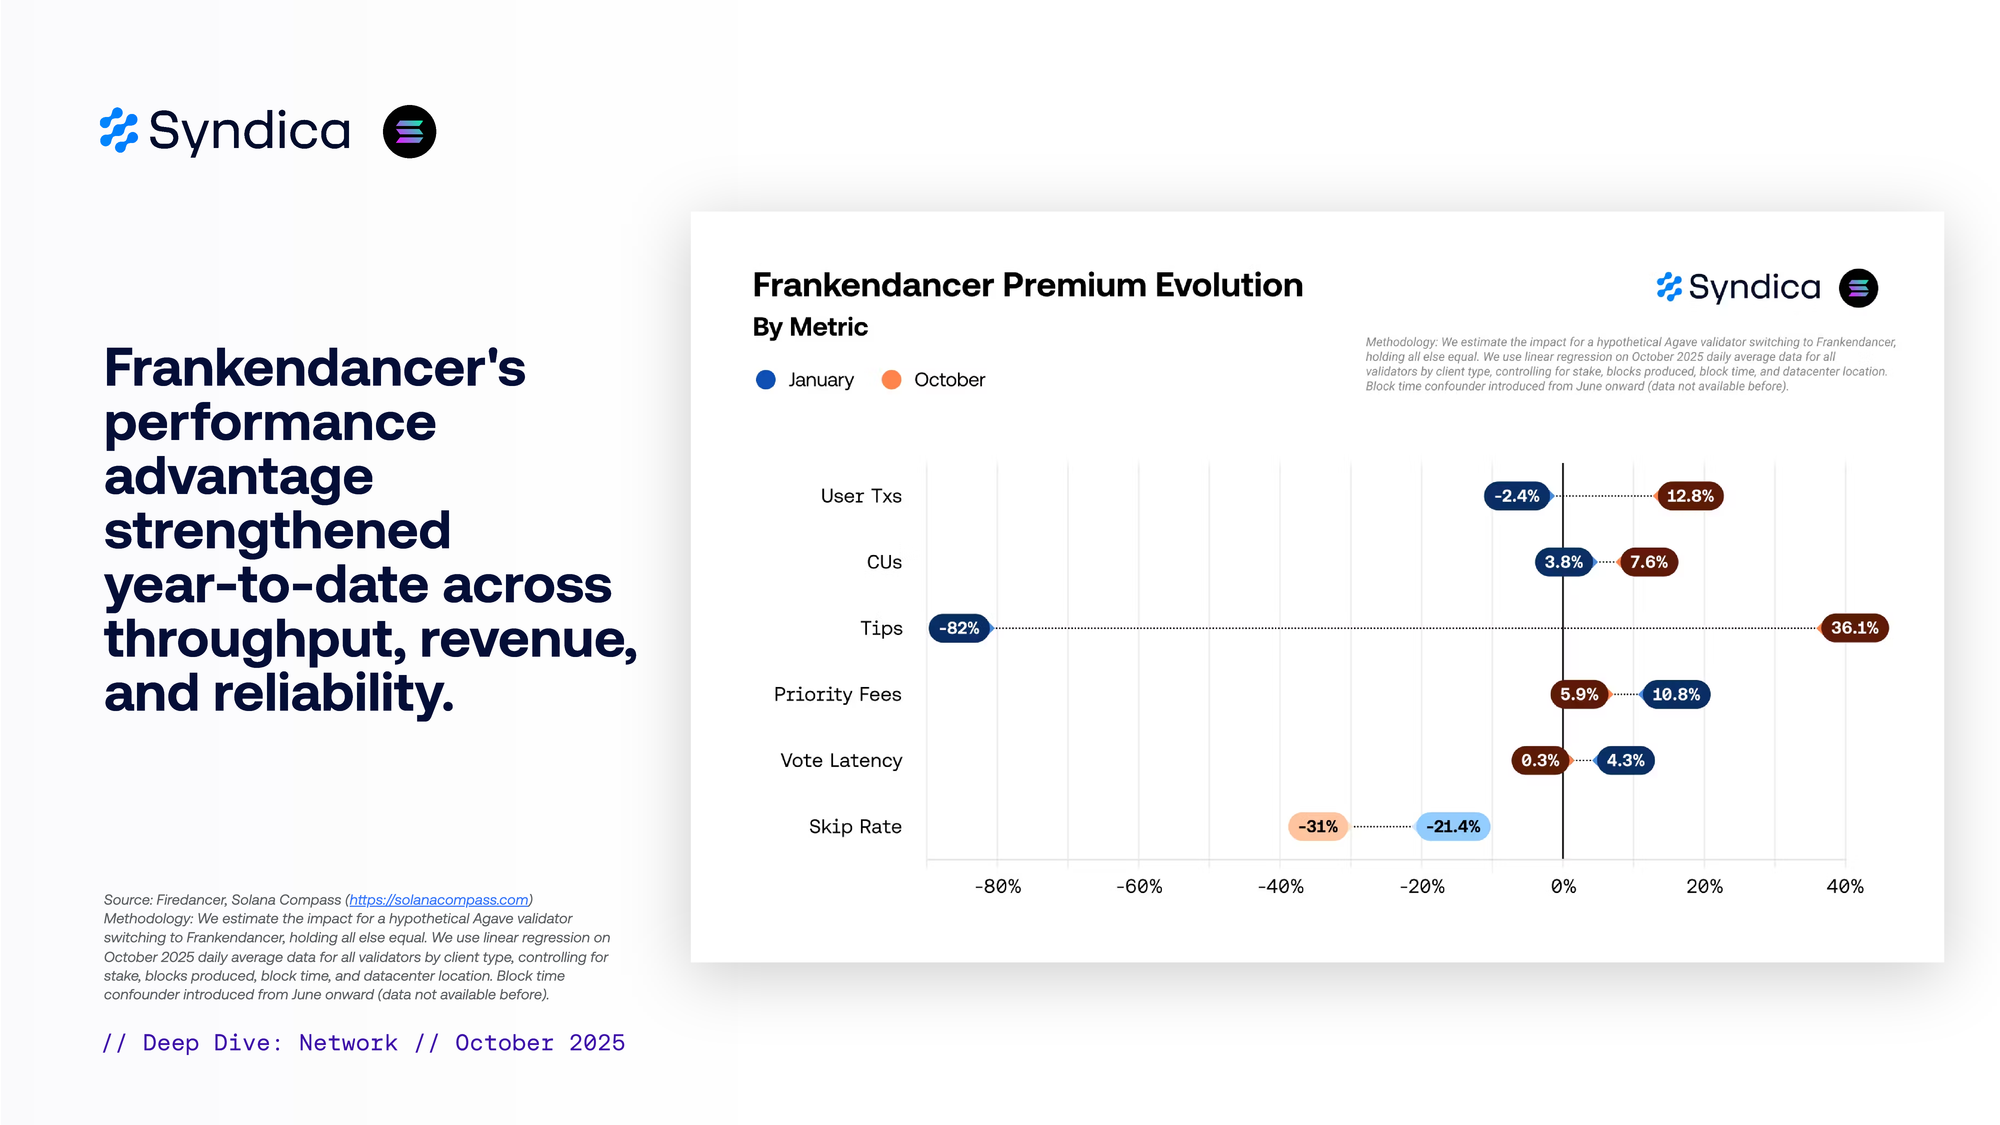
Frankendancer delivers higher throughput and revenue with no reliability cost. By October 2025, Frankendancer validators processed 13% more non-vote transactions, pack blocks with 8% more CUs, and earn 36% more in tips, and 6% more in priority fees per block than Agave. These throughput and revenue gains come at very little cost to reliability: vote latency differs by just 0.3%, and skip rate differences are not statistically significant after controlling for confounders.
Frankendancer's performance advantage strengthened year-to-date across throughput, revenue, and reliability.
Part III - Validators
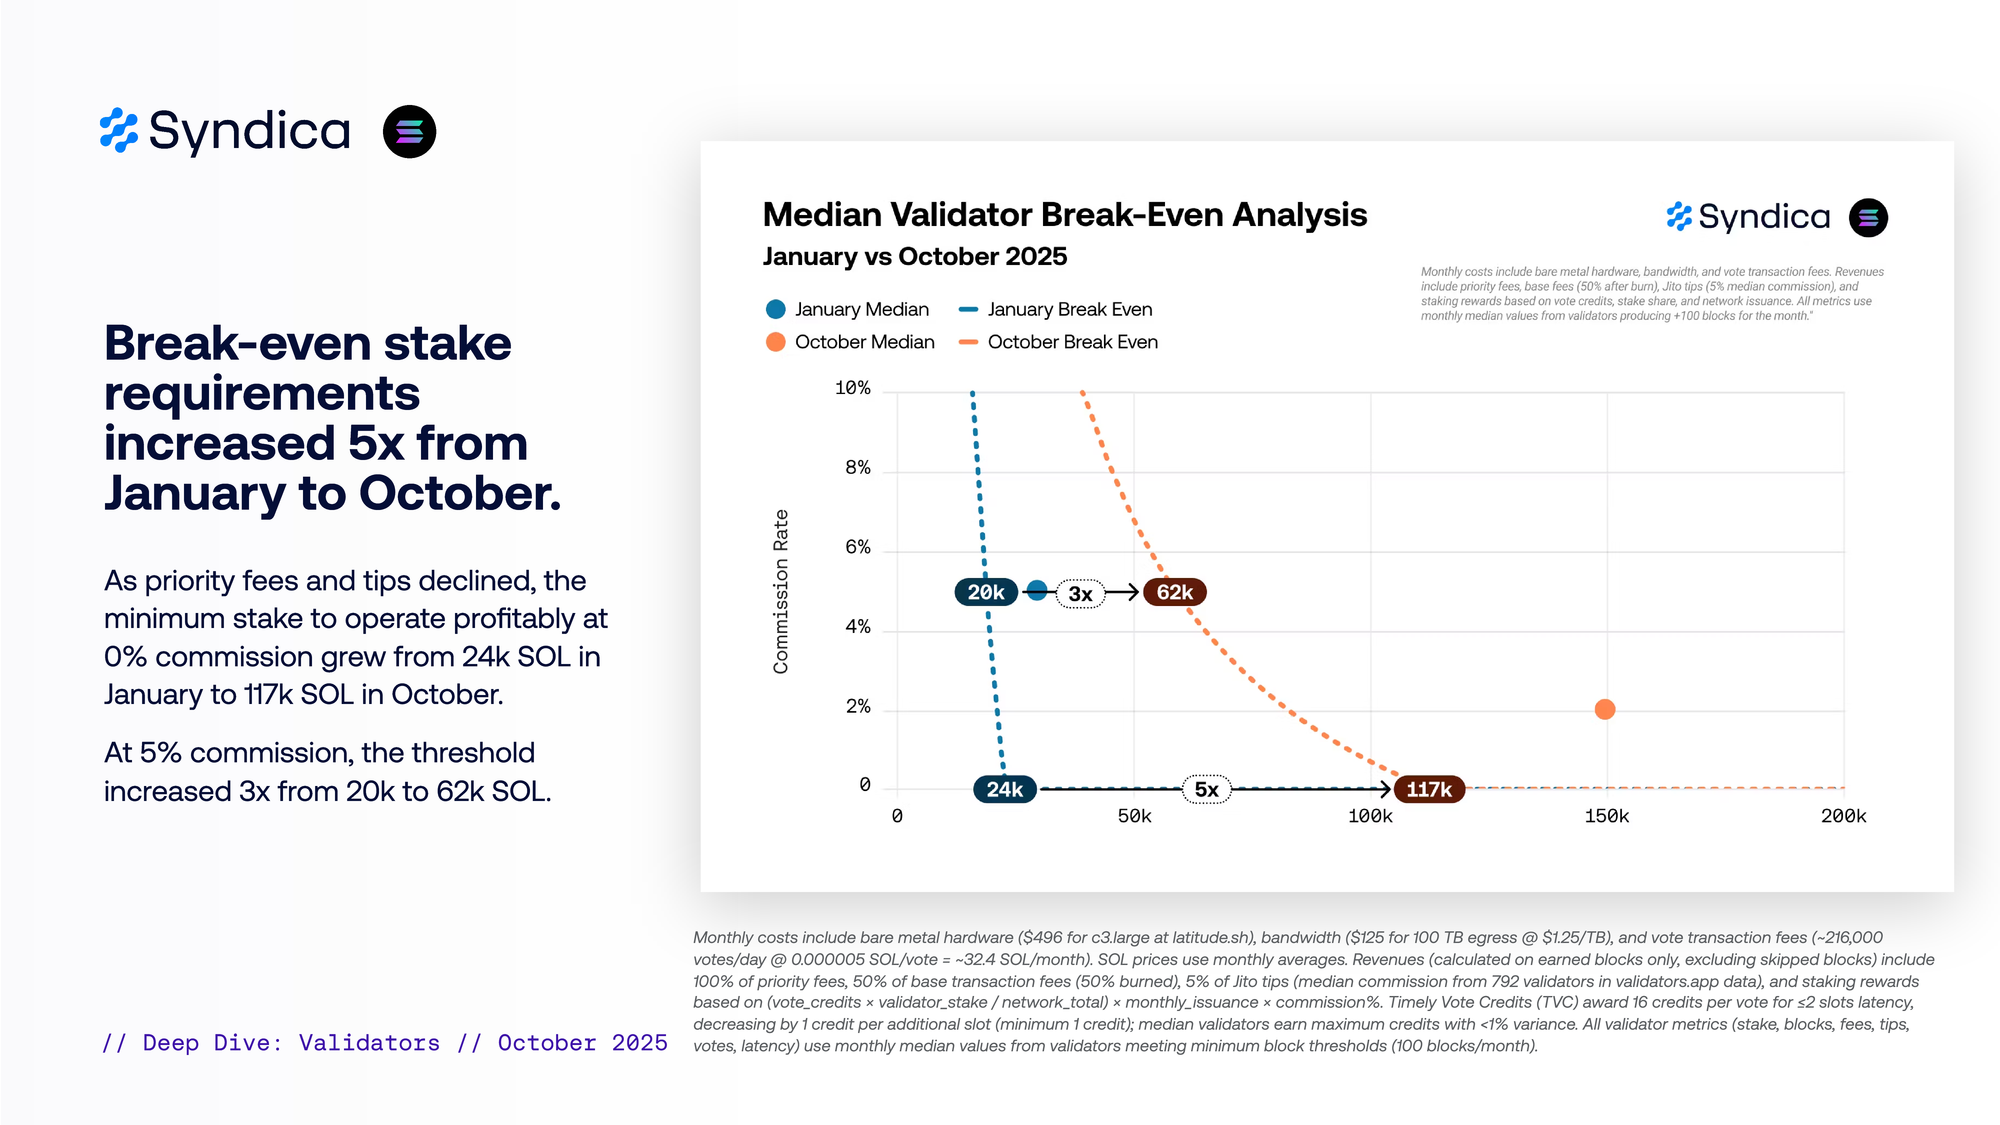
Break-even stake requirements increased 5x from January to October. As priority fees and tips declined, the minimum stake to operate profitably at 0% commission grew from 24k SOL in January to 117k SOL in October. At 5% commission, the threshold increased 3x from 20k to 62k SOL.
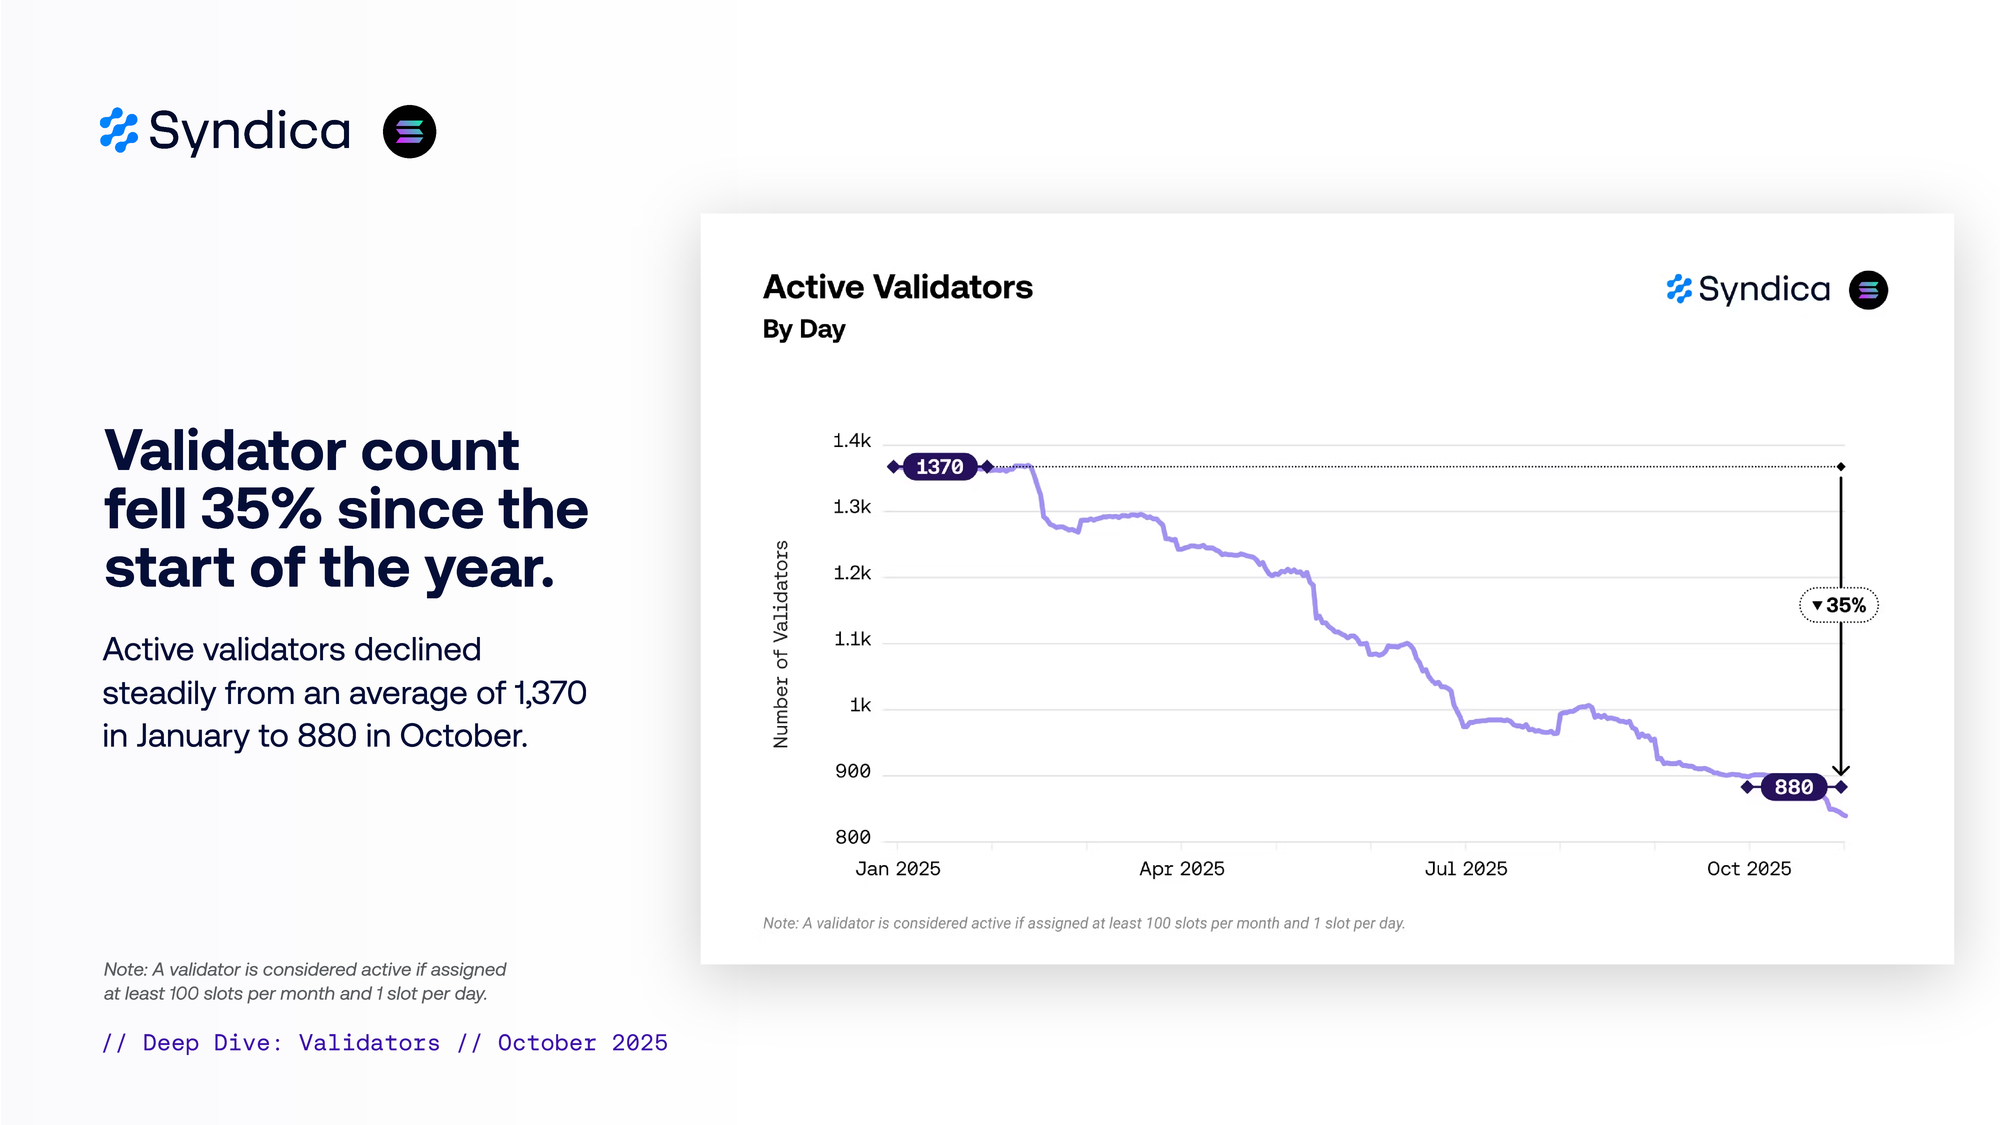
Validator count fell 35% since the start of the year. Active validators declined steadily from an average of 1,370 in January to 880 in October.
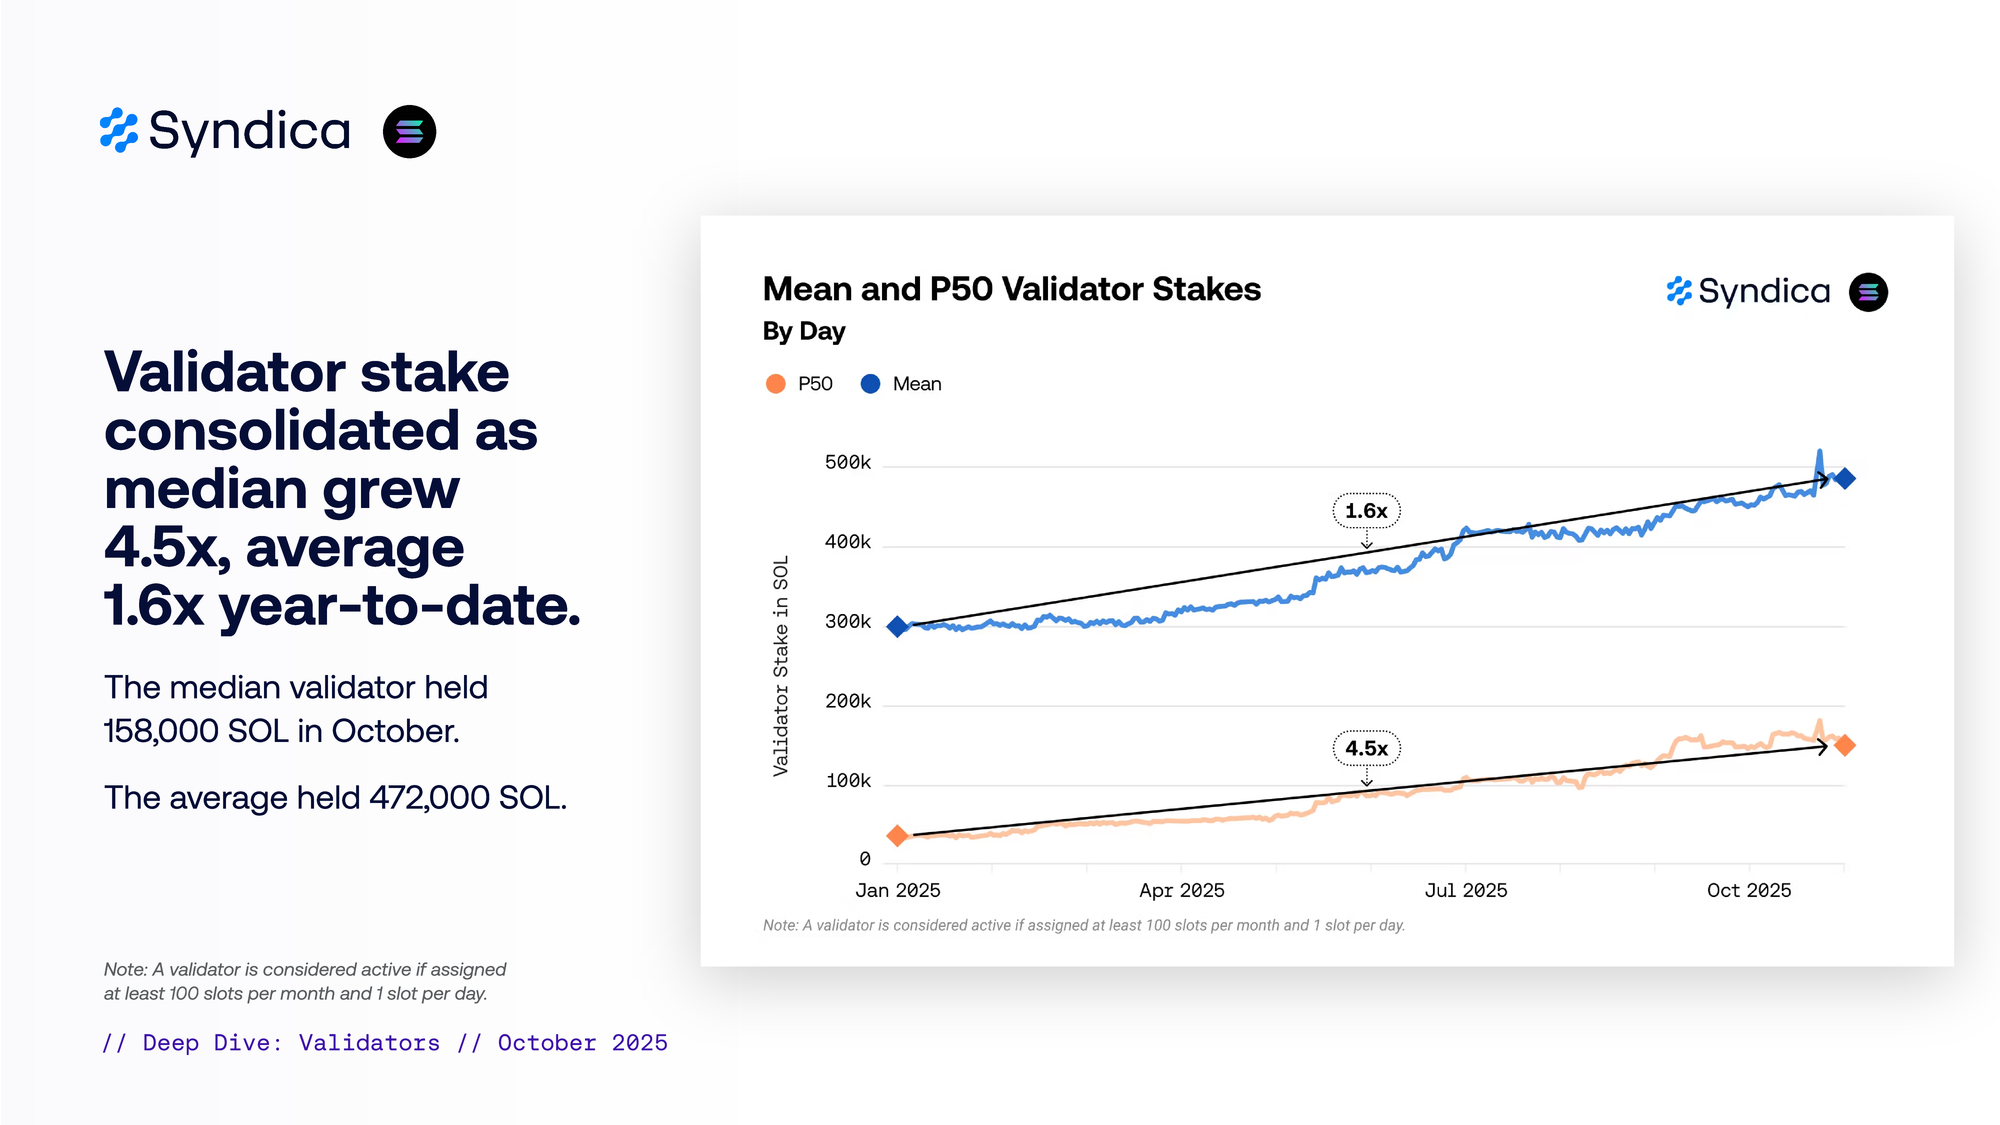
Validator stake consolidated as median grew 4.5x, average 1.6x year-to-date. The median validator held 158,000 SOL in October. The average held 472,000 SOL.
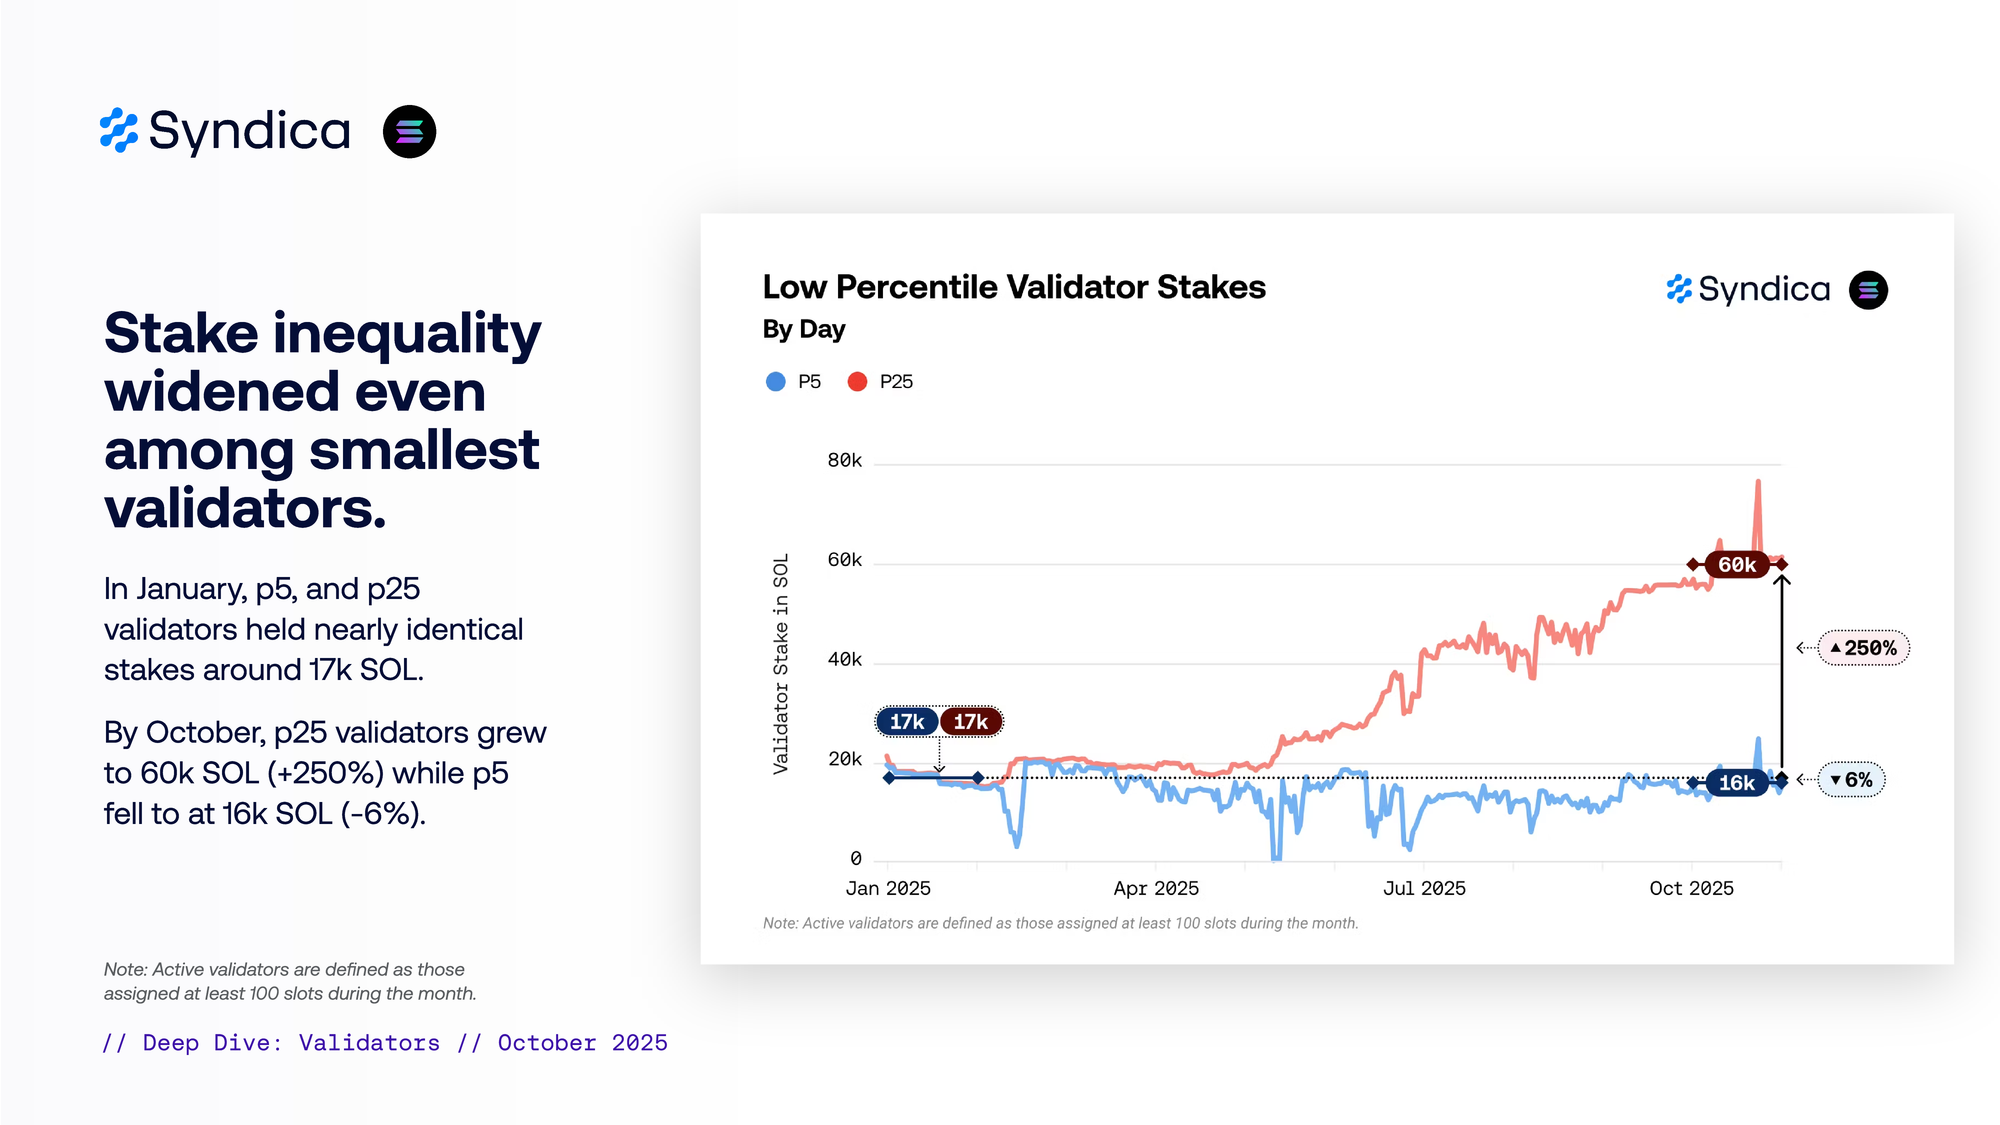
Stake inequality widened even among the smallest validators. In January, p5 and p25 validators held nearly identical stakes around 17k SOL. By October, p25 validators grew to 60k SOL (+250%) while p5 fell to at 16k SOL (-6%).
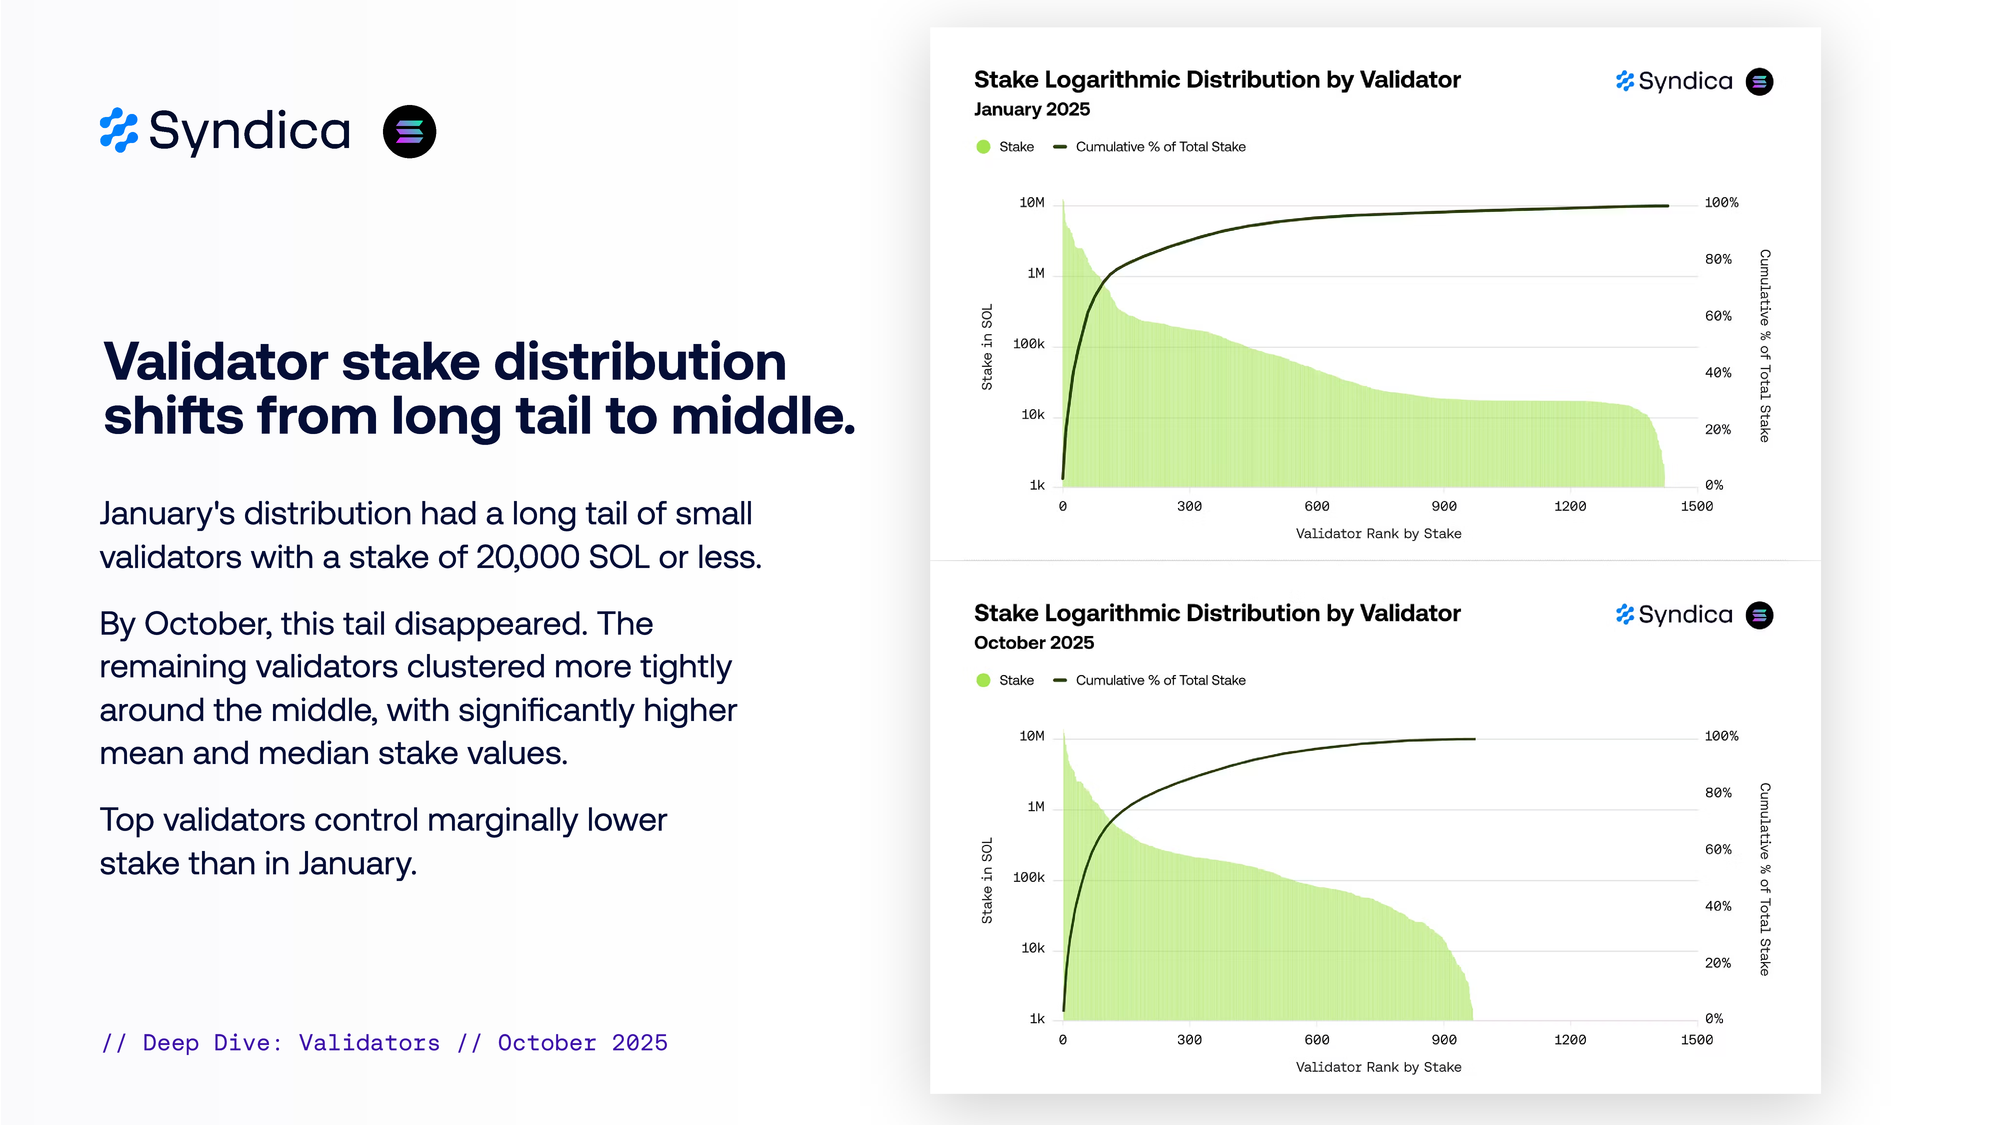
Validator stake distribution shifts from long tail to middle. January's distribution had a long tail of small validators with a stake of 20,000 SOL or less. By October, this tail disappeared. The remaining validators cluster more tightly around the middle, with significantly higher mean and median stake values. Top validators controlled marginally lower stake than in January.
Part IV - Decentralization
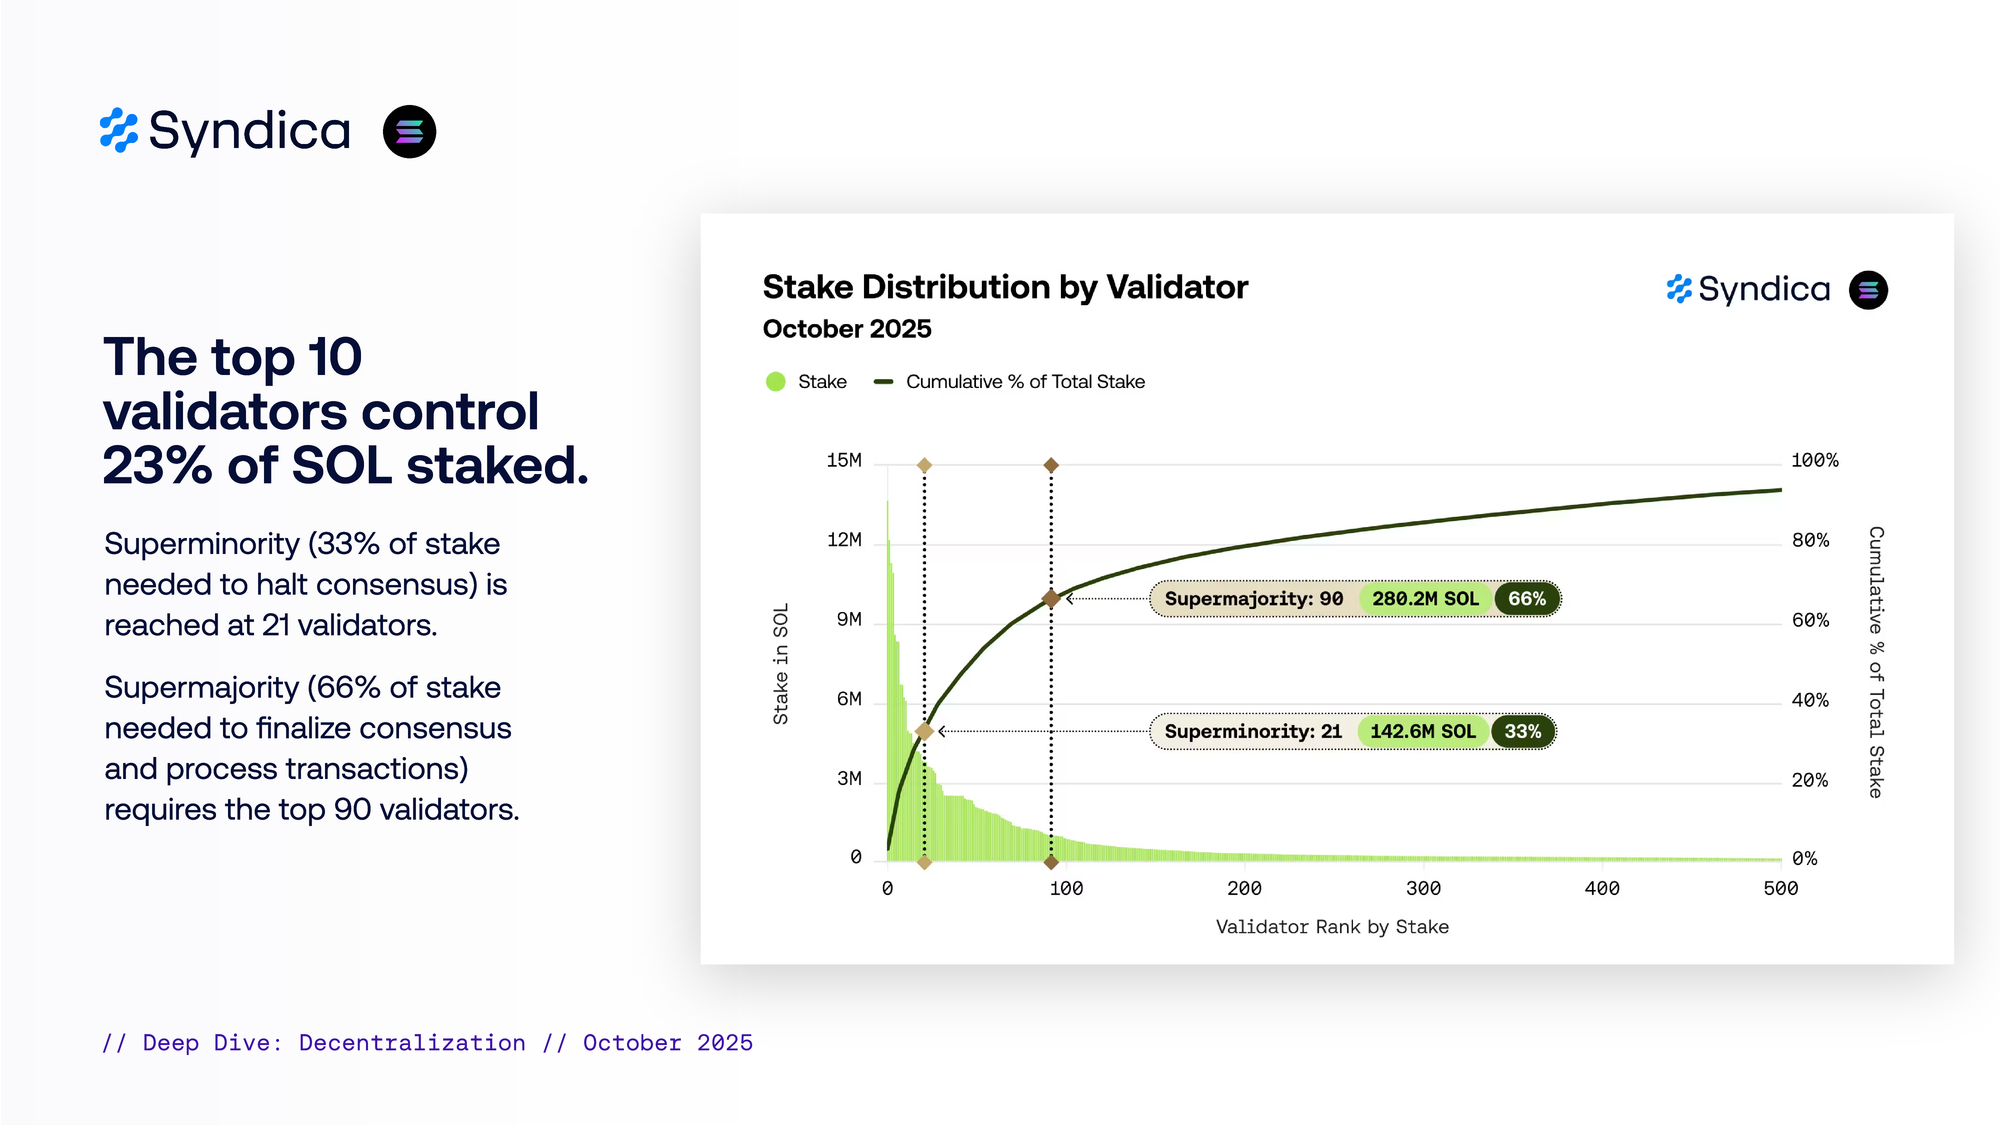
The top 10 validators controlled 23% of SOL staked. Superminority (33% of stake needed to halt consensus) is reached at 21 validators. Supermajority (66% of stake needed to finalize consensus and process transactions) required the top 90 validators.
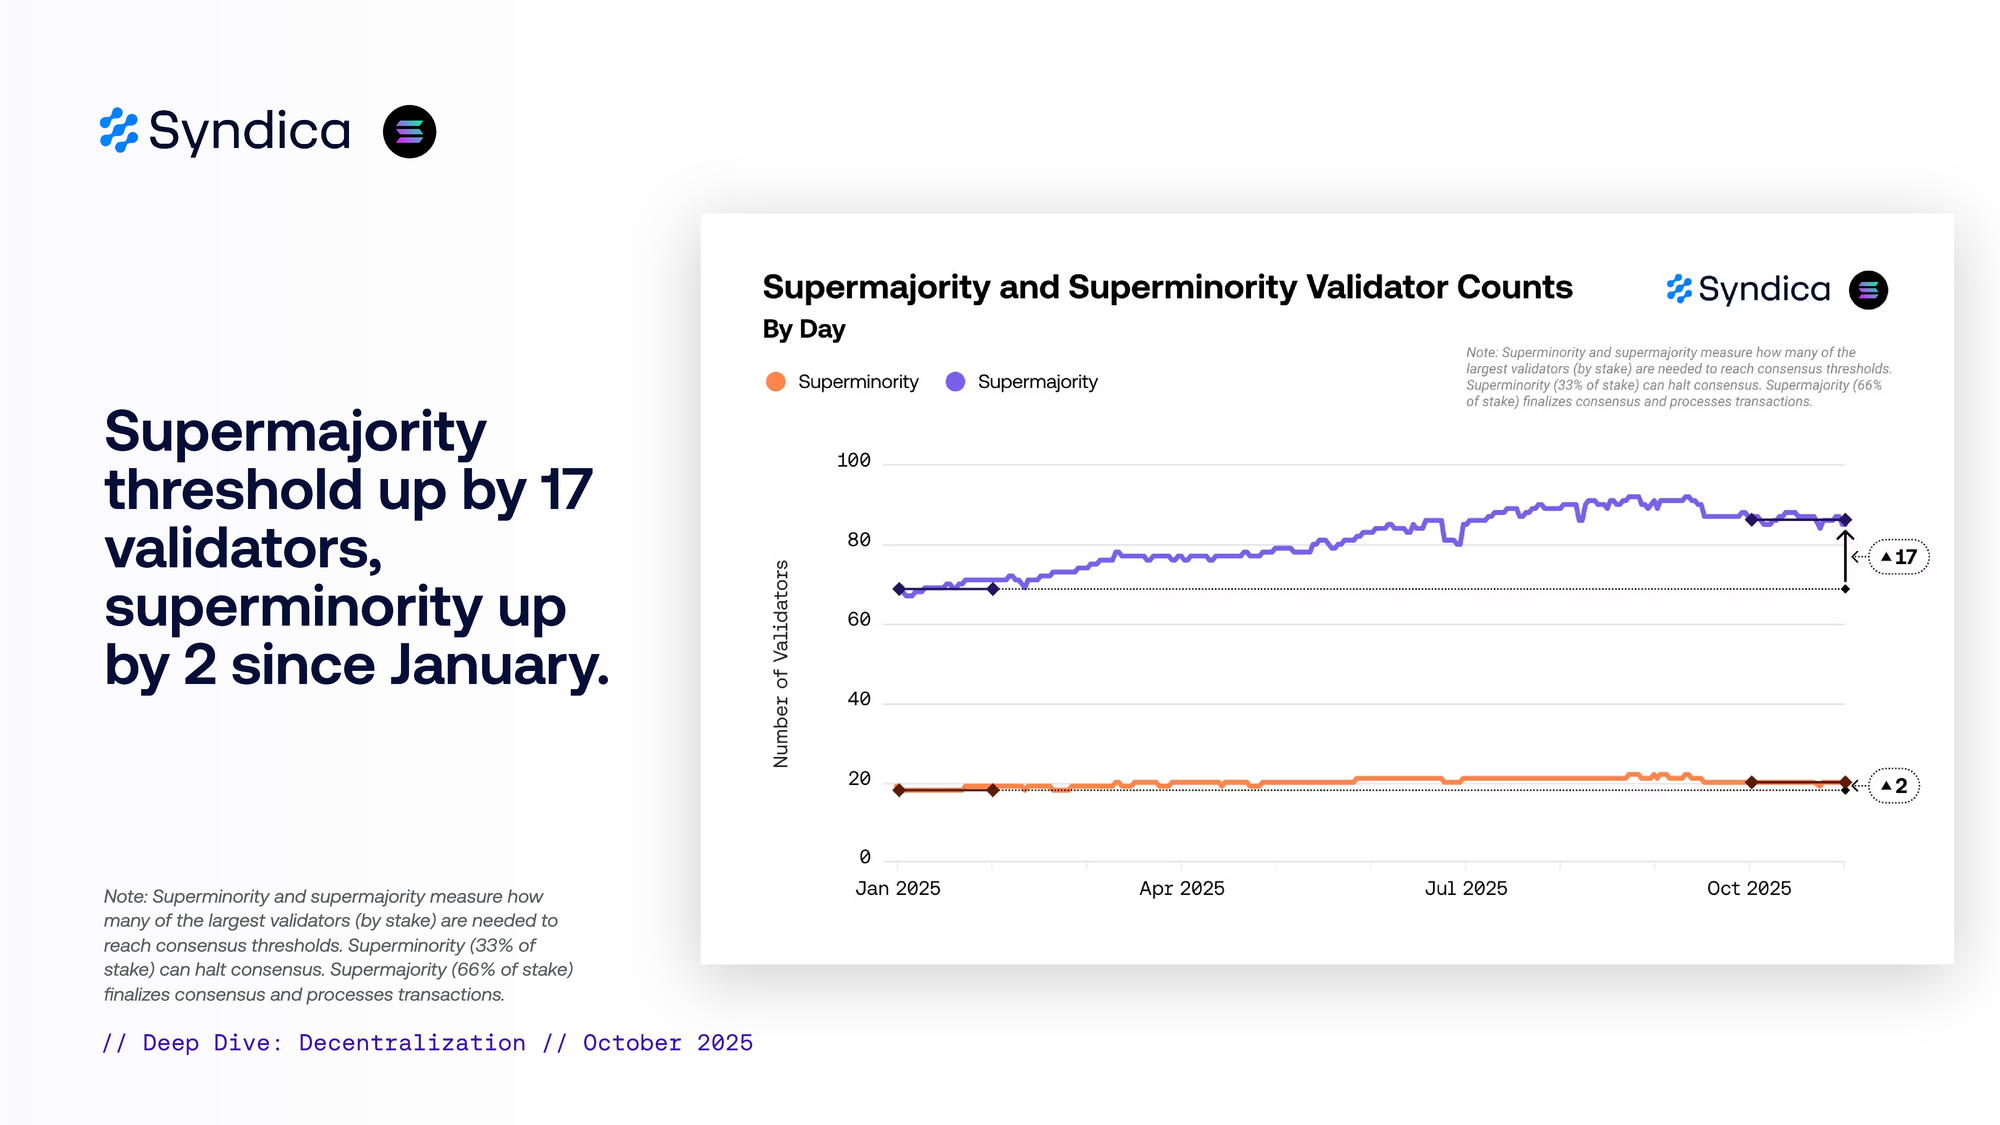
Supermajority threshold is up by 17 validators, superminority is up by 2 since January.
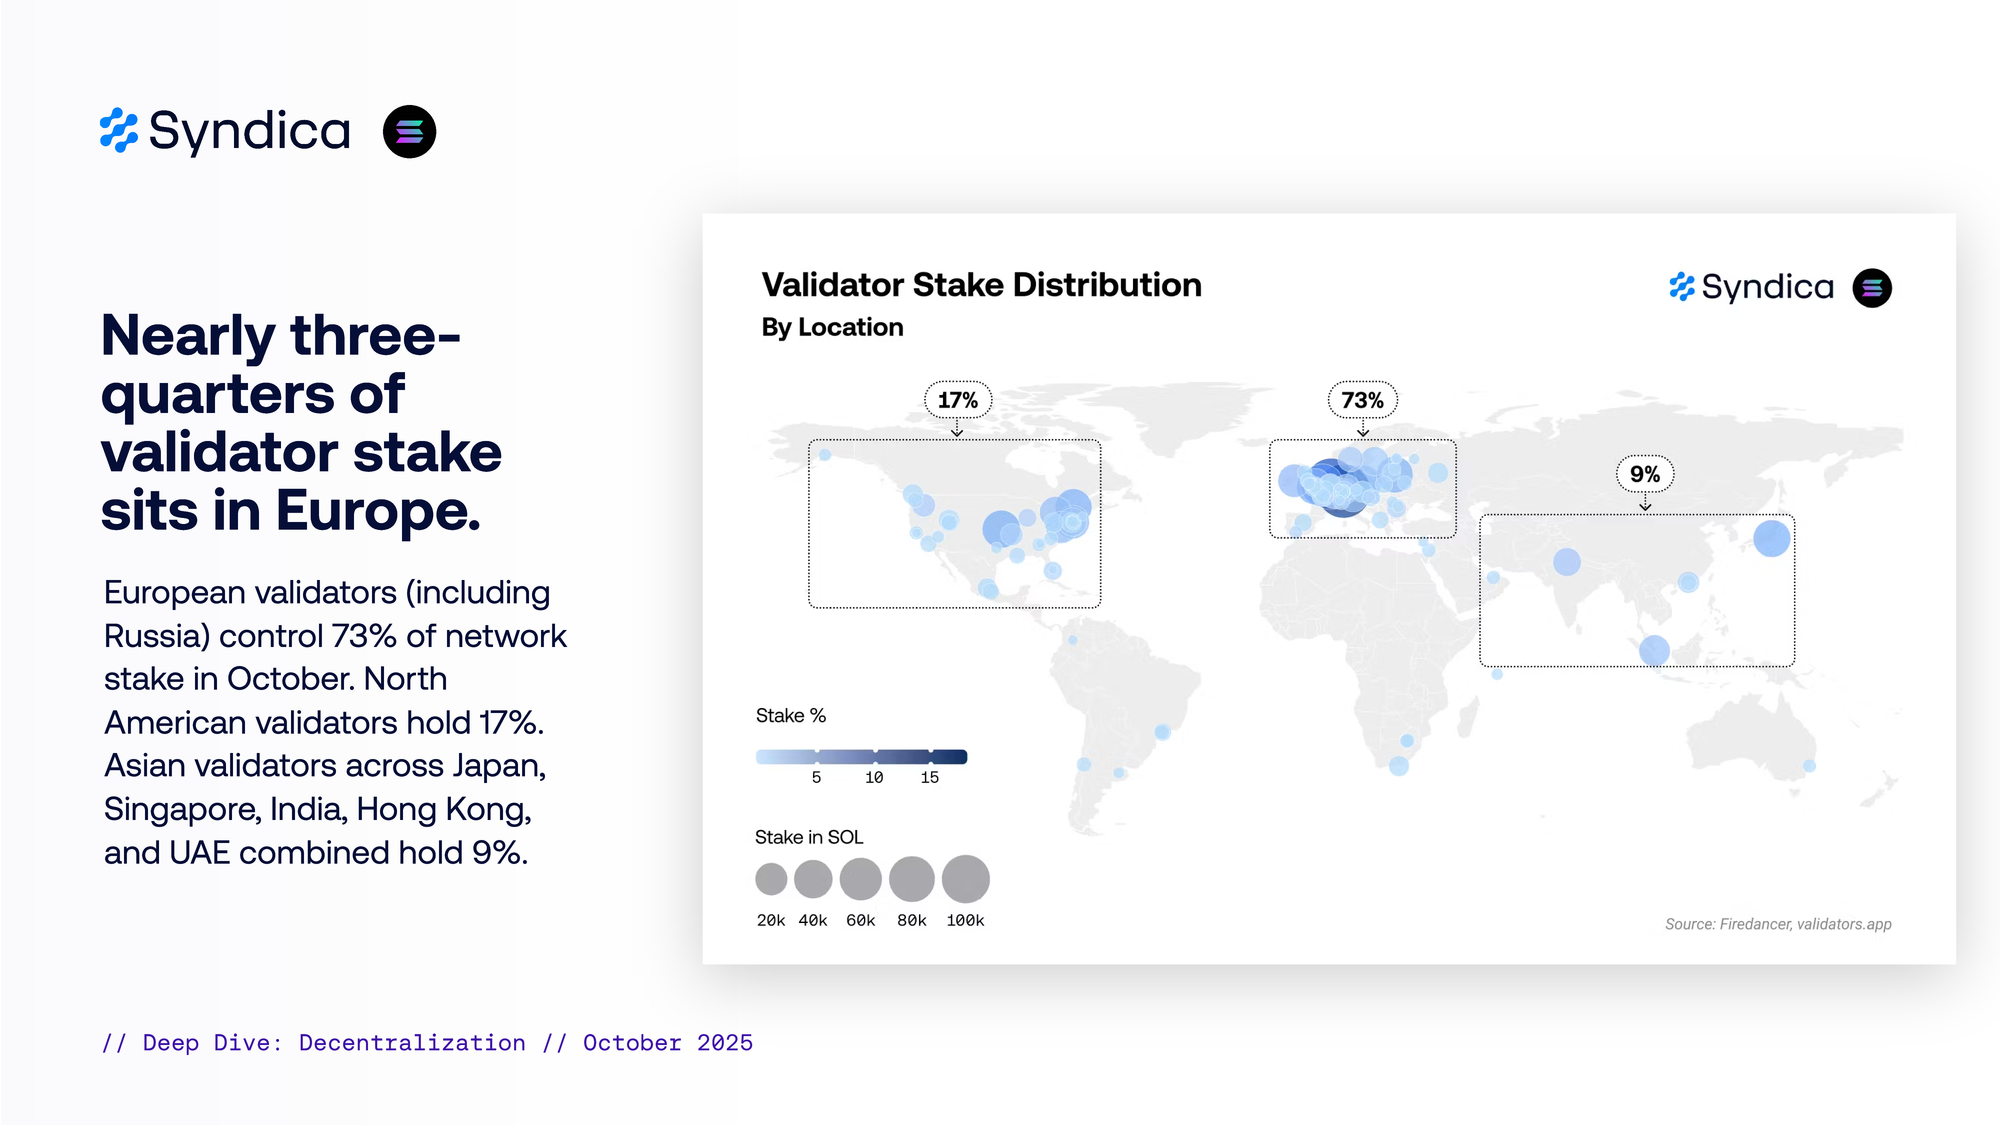
Nearly three-quarters of validator stake sits in Europe. European validators (including Russia) control 73% of network stake in October. North American validators hold 17%. Asian validators across Japan, Singapore, India, Hong Kong, and UAE combined hold 9%.
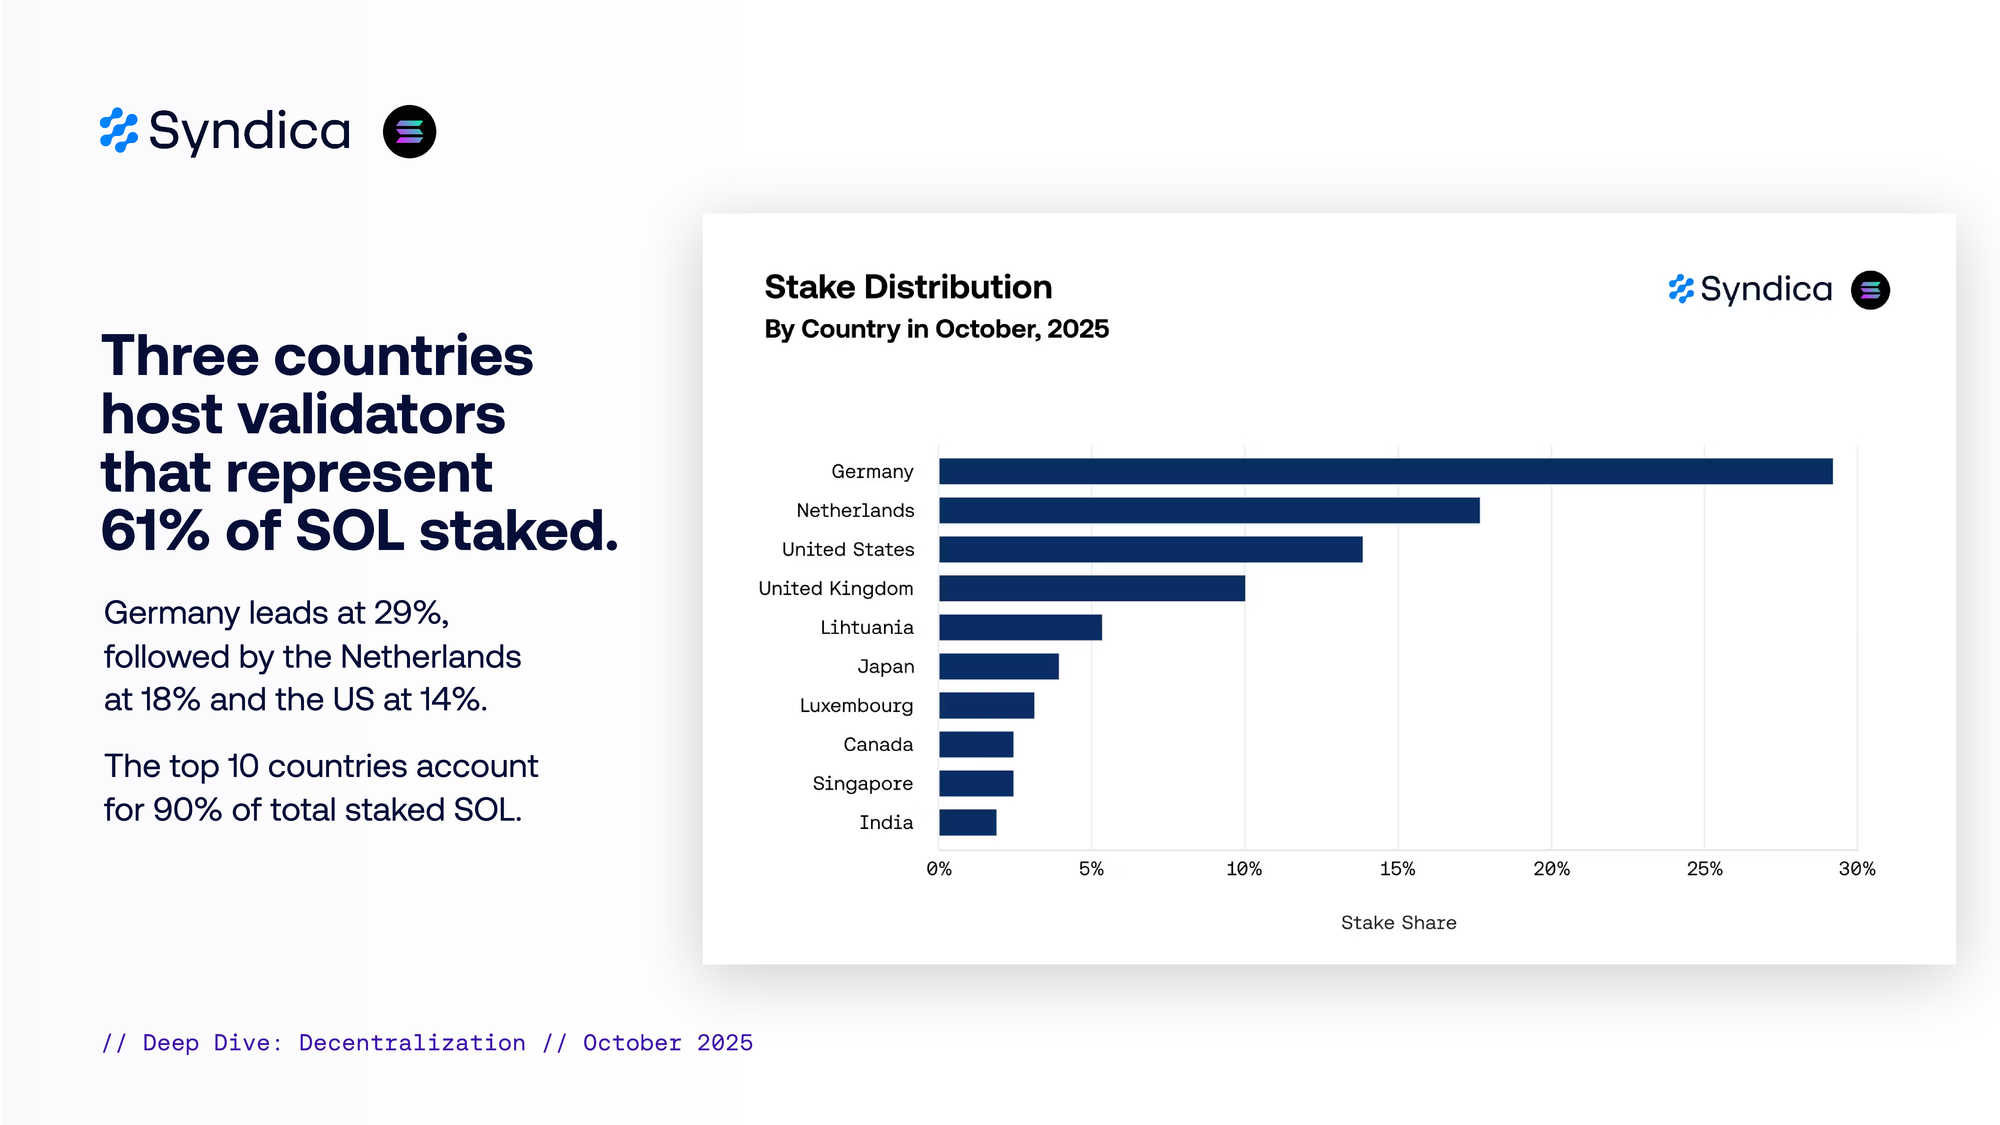
Three countries host validators that represent 61% of SOL staked. Germany leads at 29%, followed by the Netherlands at 18% and the US at 14%. The top 10 countries account for 90% of total staked SOL.
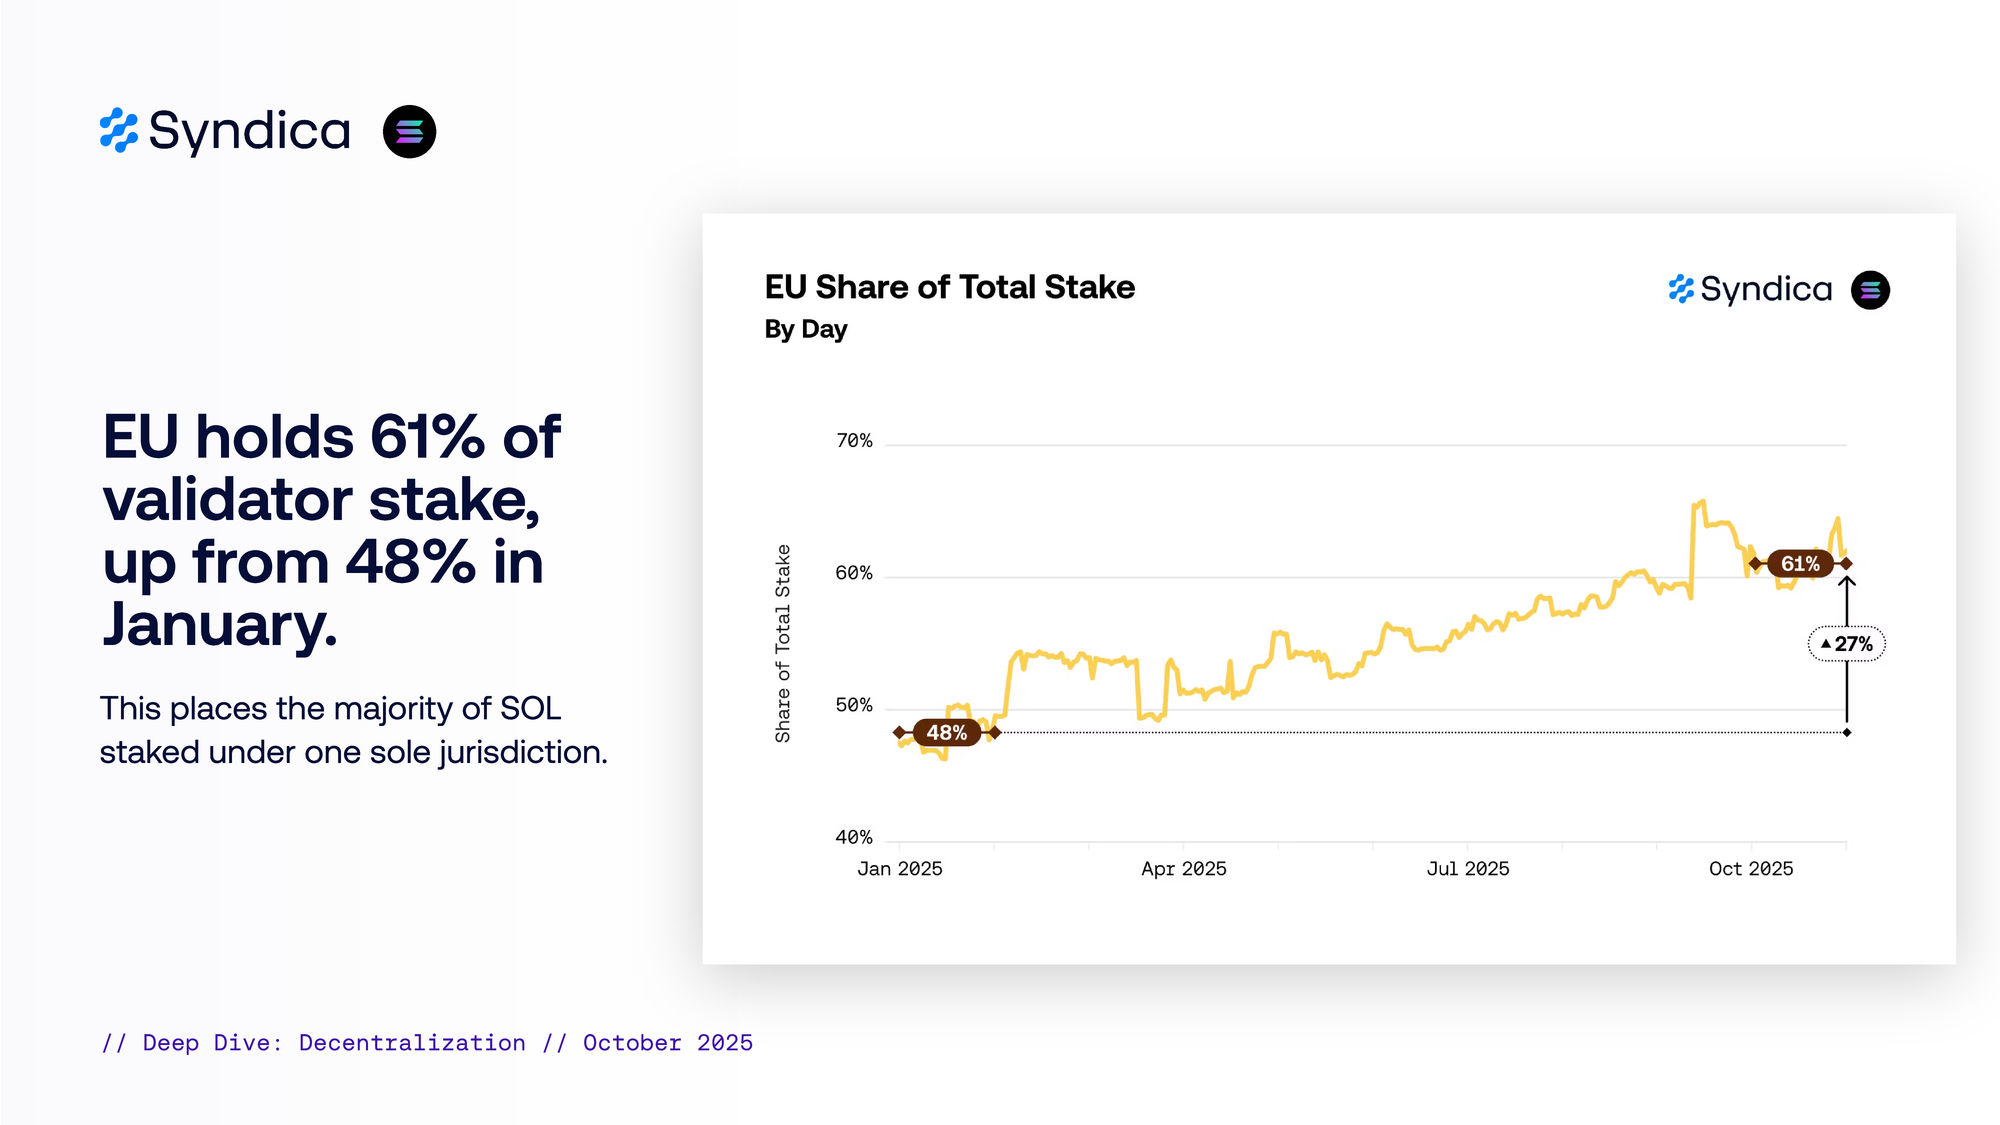
EU holds 61% of validator stake, up from 48% in January. This places the majority of SOL staked under one sole jurisdiction.
Part V - Compute Units
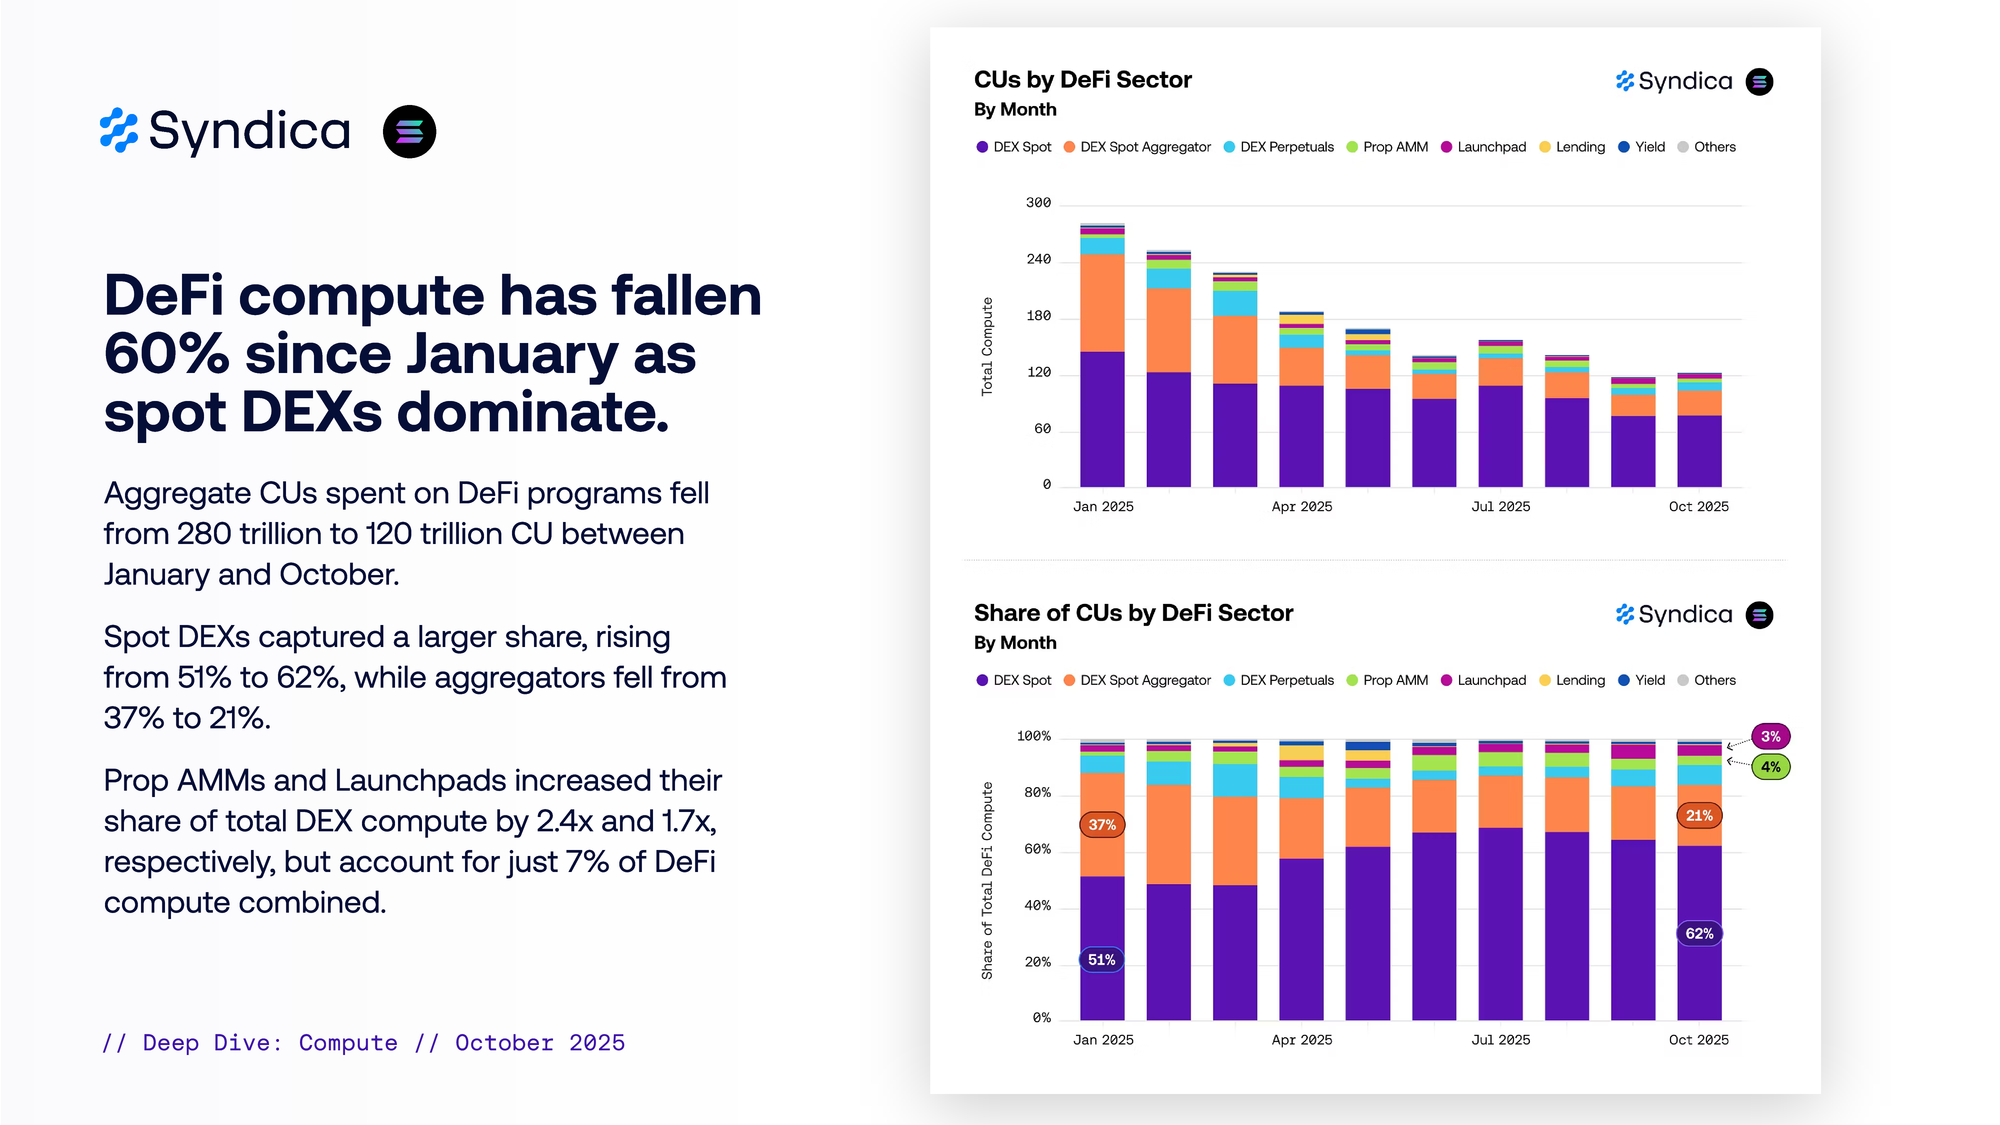
DeFi compute has fallen 60% since January as spot DEXs dominate. Aggregate CUs spent on DeFi programs fell from 280 trillion to 120 trillion CU between January and October. Spot DEXs captured a larger share, rising from 51% to 62%, while aggregators fell from 37% to 21%. Prop AMMs and Launchpads increased their share of total DEX compute by 2.4x and 1.7x, respectively, but account for just 7% of DeFi compute combined.
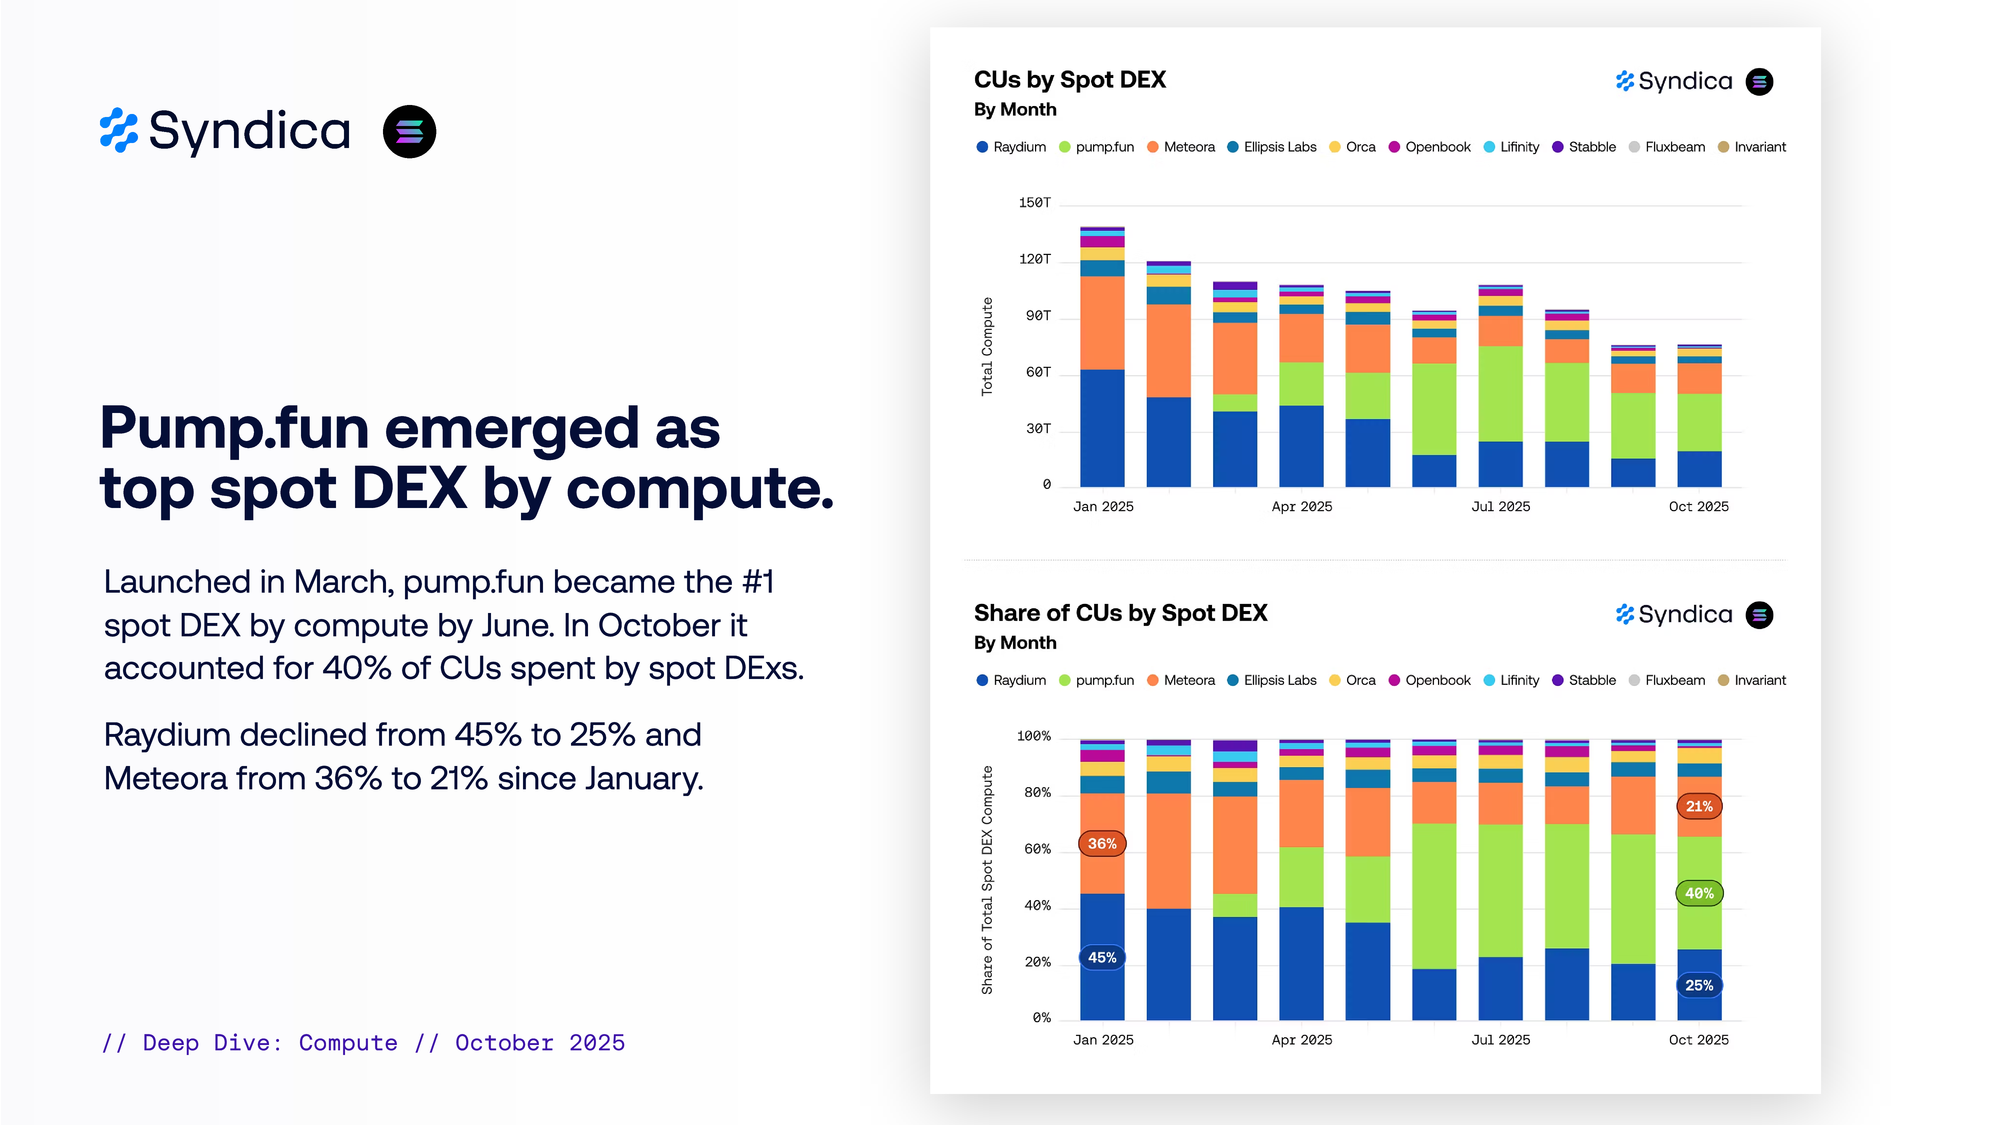
Pump.fun emerged as top spot DEX by compute. Launched in March, pump.fun became the #1 spot DEX by compute by June. In October it accounted for 40% of CUs spent by spot DExs. Raydium declined from 45% to 25% and Meteora from 36% to 21% since January.
Appendix - Background Theory
Validators and Block Production
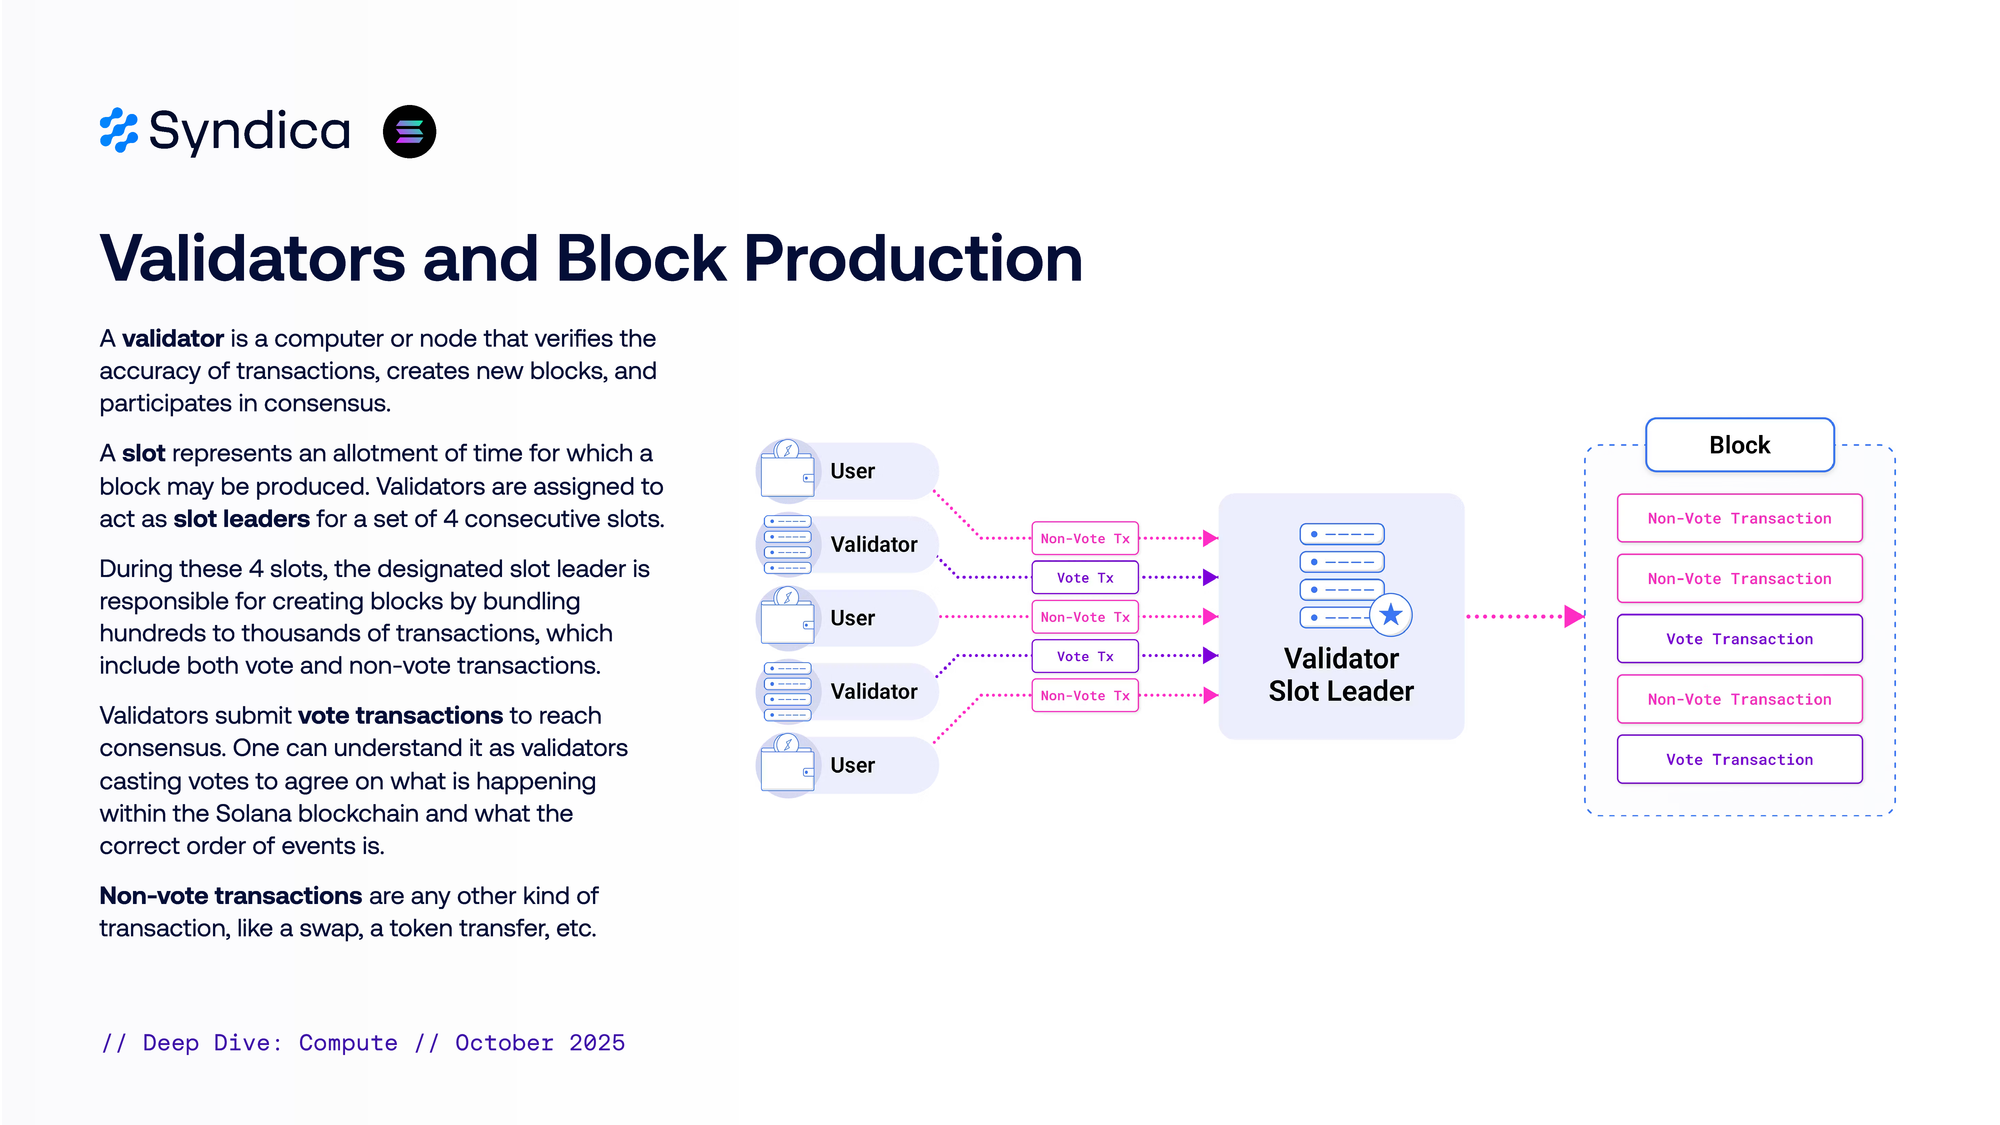
A validator is a computer or node that verifies the accuracy of transactions, creates new blocks, and participates in consensus.
A slot represents an allotment of time for which a block may be produced. Validators are assigned to act as slot leaders for a set of 4 consecutive slots.
During these 4 slots, the designated slot leader is responsible for creating blocks by bundling hundreds to thousands of transactions, which include both vote and non-vote transactions.
Validators submit vote transactions to reach consensus. One can understand it as validators casting votes to agree on what is happening within the Solana blockchain and what the
correct order of events is.
Non-vote transactions are any other kind of transaction, like a swap, a token transfer, etc.
Measuring Network Performance
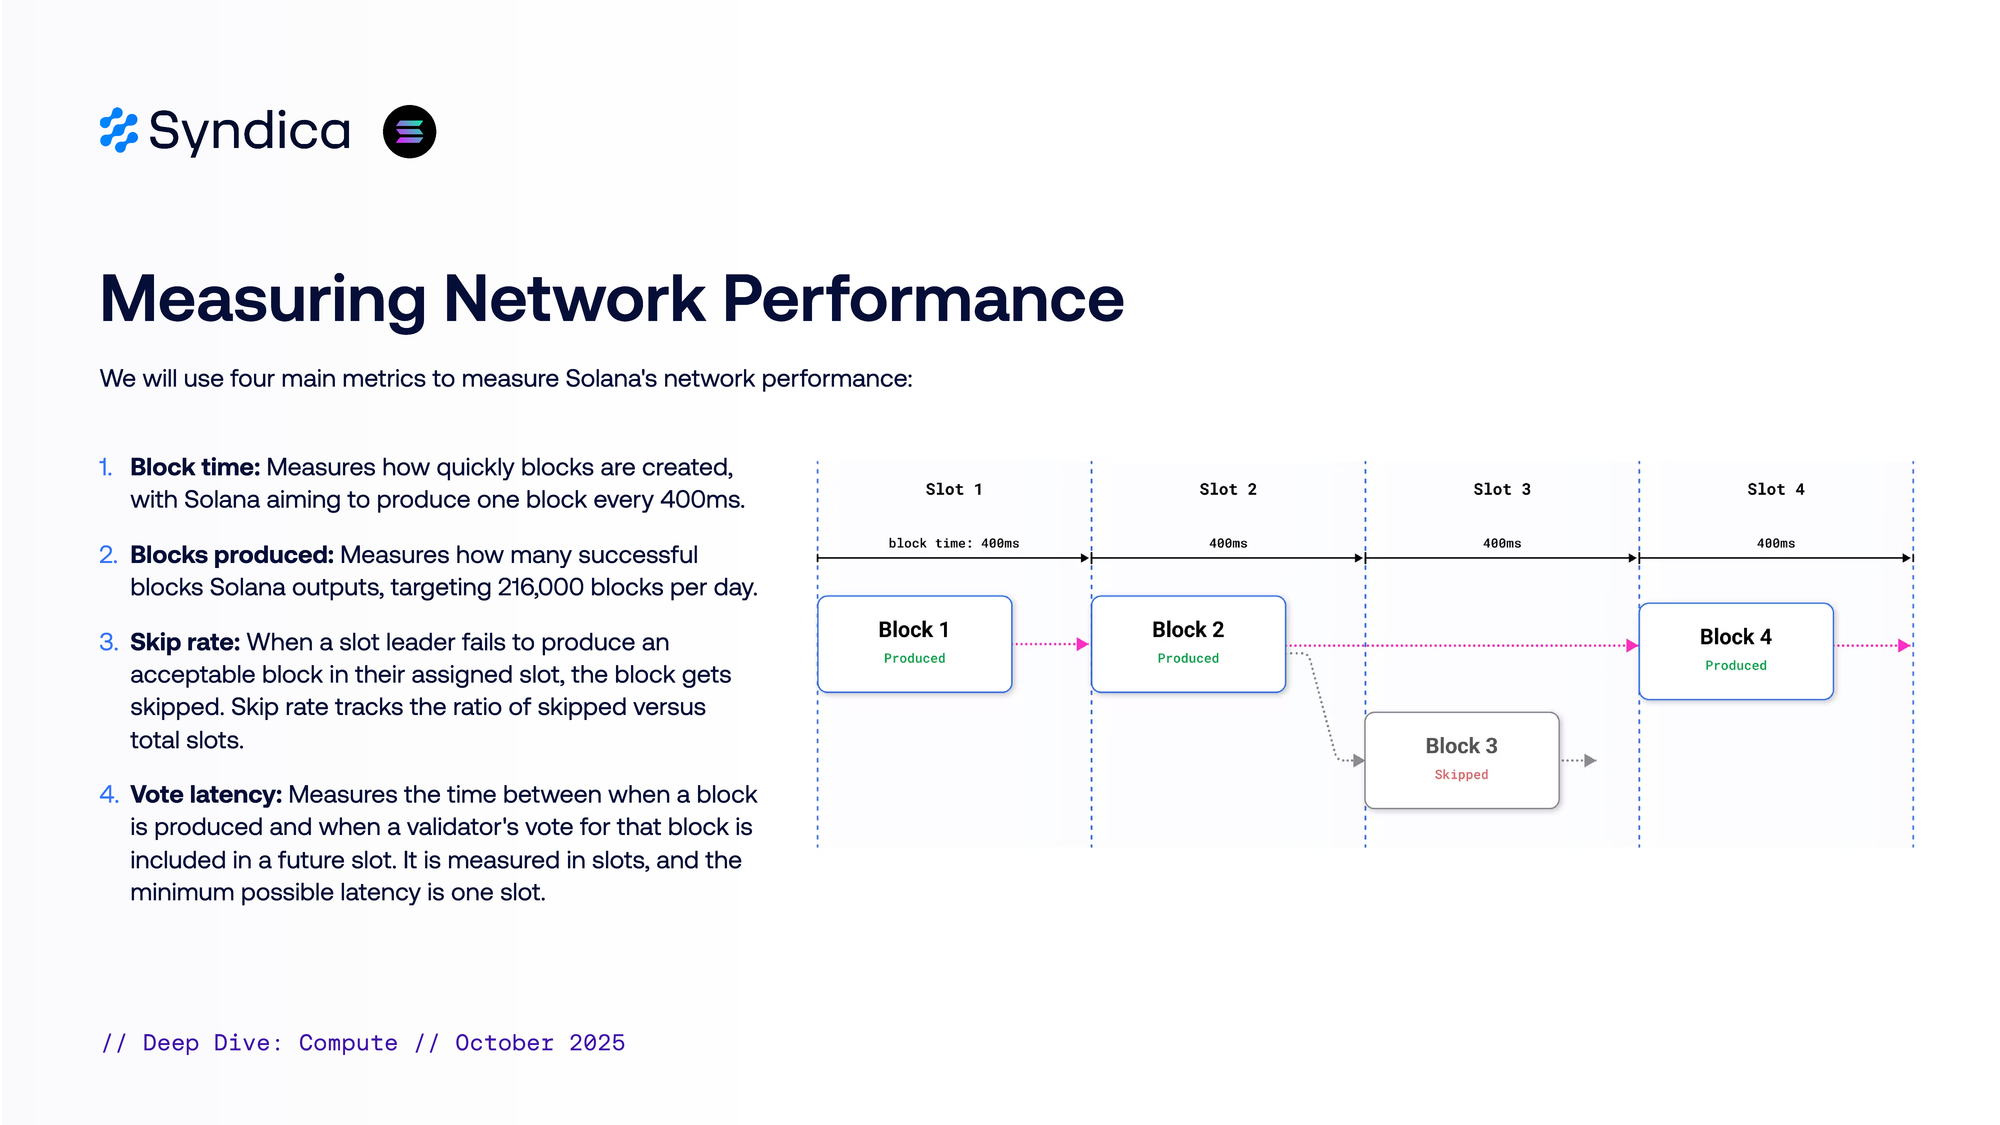
We will use four main metrics to measure Solana's network performance:
- Block time: Measures how quickly blocks are created, with Solana aiming to produce one block every 400ms.
- Blocks produced: Measures how many successful blocks Solana outputs, targeting 216,000 blocks per day.
- Skip rate: When a slot leader fails to produce an acceptable block in their assigned slot, the block gets skipped. Skip rate tracks the ratio of skipped versus total slots.
- Vote latency: Measures the time between when a block is produced and when a validator's vote for that block is included in a future slot. It is measured in slots, and the minimum possible latency is one slot.
What are compute units (CU)?
On-chain transactions consume computational resources, quantified in compute units (CU). Each CU generally corresponds to one Berkeley Packet Filter (BPF) instruction (e.g., basic arithmetic like addition or subtraction), with estimates for more complex ones.
BPF started as a kernel tool for efficient packet filtering in Linux, later extending to eBPF for broader, high-performance applications in networking and tracing. Solana uses sBPF, a modified version that creates a virtual machine for eBPF programs.
Understanding Solana's fee structure
There are three types of transaction fees in Solana: base, vote, and priority.
- Transaction fees are fixed at 5,000 lamports per signature. 50% goes to the block leader, 50% is burnt. They apply to:
- Non-vote transactions for user activity, like swaps and transfers, are commonly known as base fees
- Vote transactions (validators participating in consensus), known as vote fees
- Priority fees are optional user payments to prioritize transaction inclusion. They are calculated by multiplying the transaction's compute unit limit by a user-defined price per compute unit.
- Tips are extra SOL payments users make to validators to speed up transaction inclusion.