Solana NFT Market Report - November 2023
Solana NFT Market Report - November 2023

Note: Below is the text-accessible version of this post for visually impaired readers.
Syndica Solana NFT Market Report - November 2023
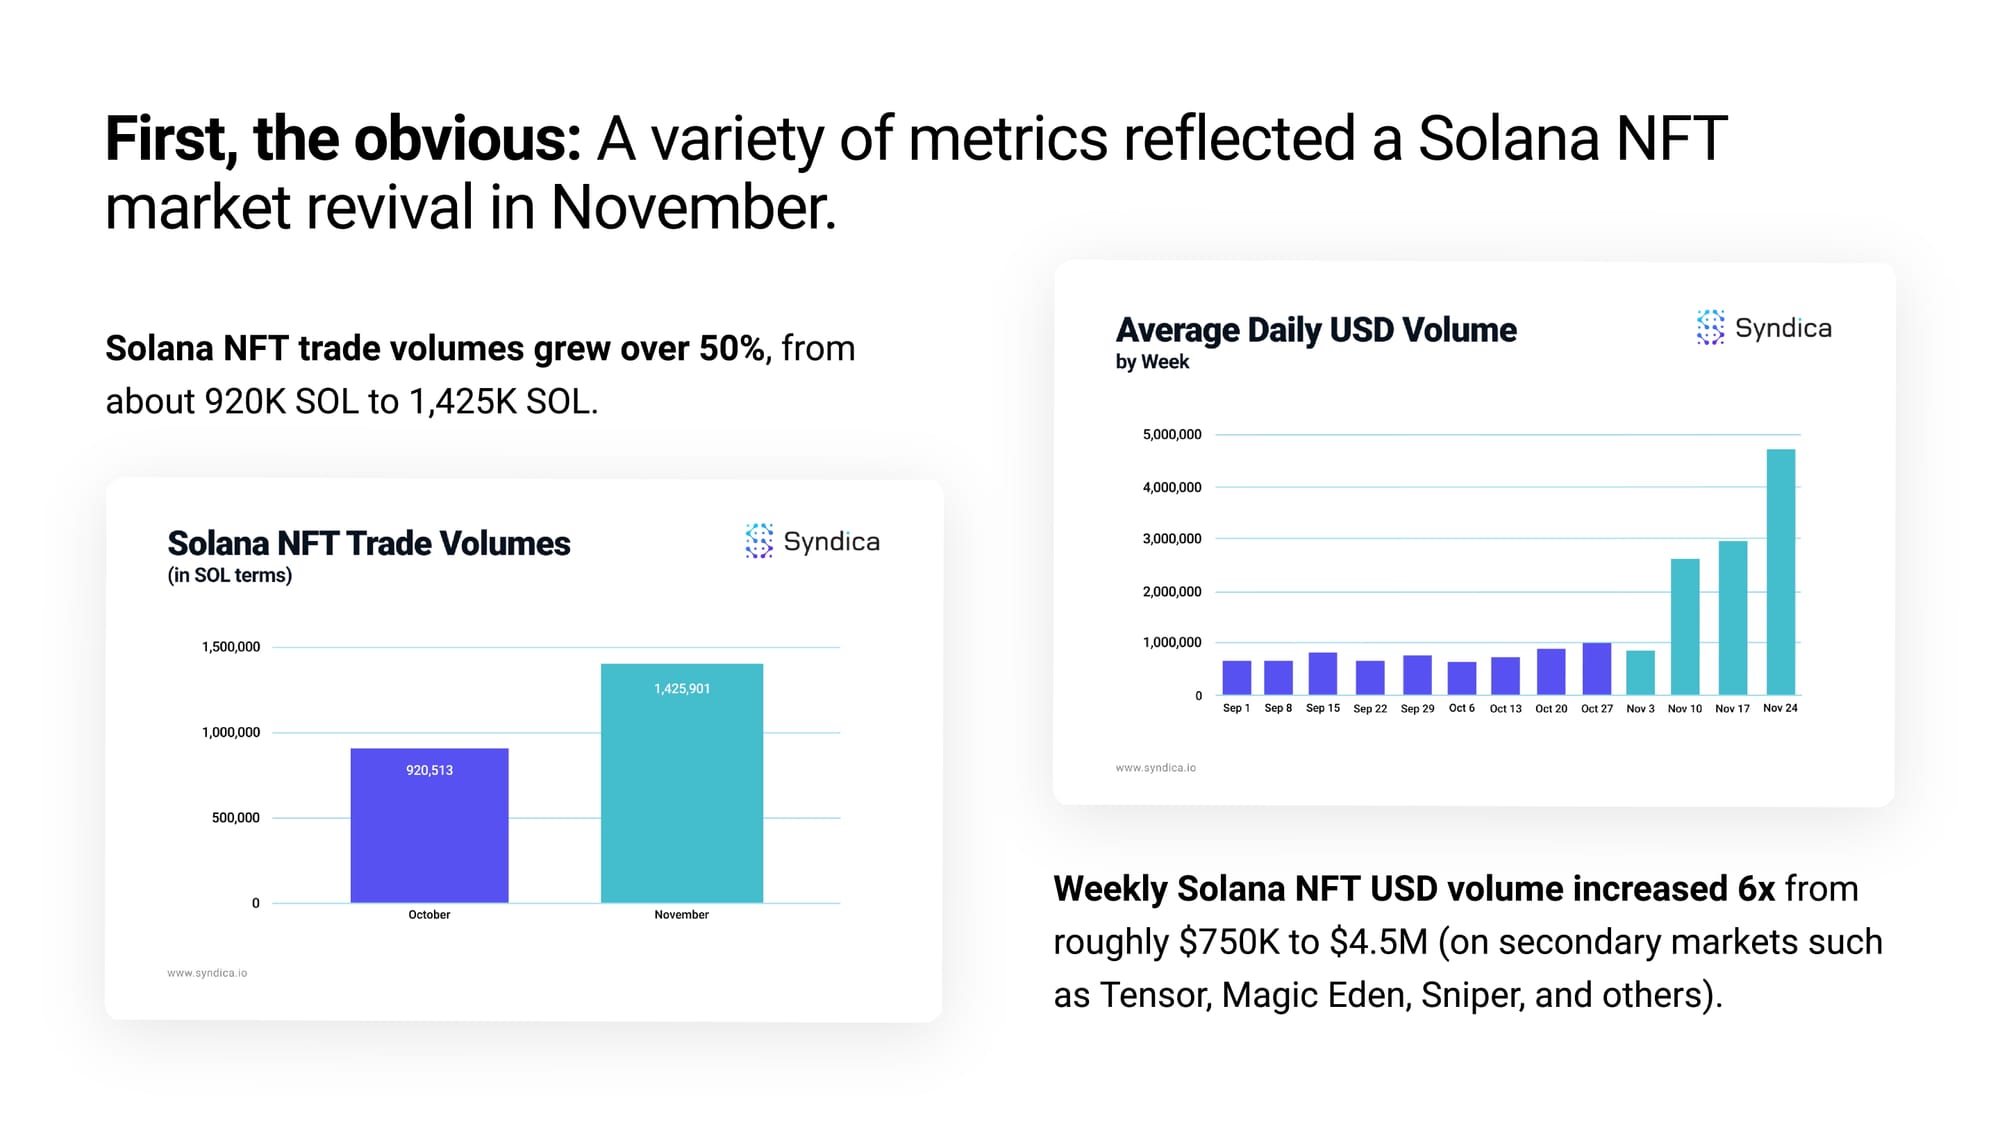
First, the obvious: A variety of metrics reflected a Solana NFT market revival in November.
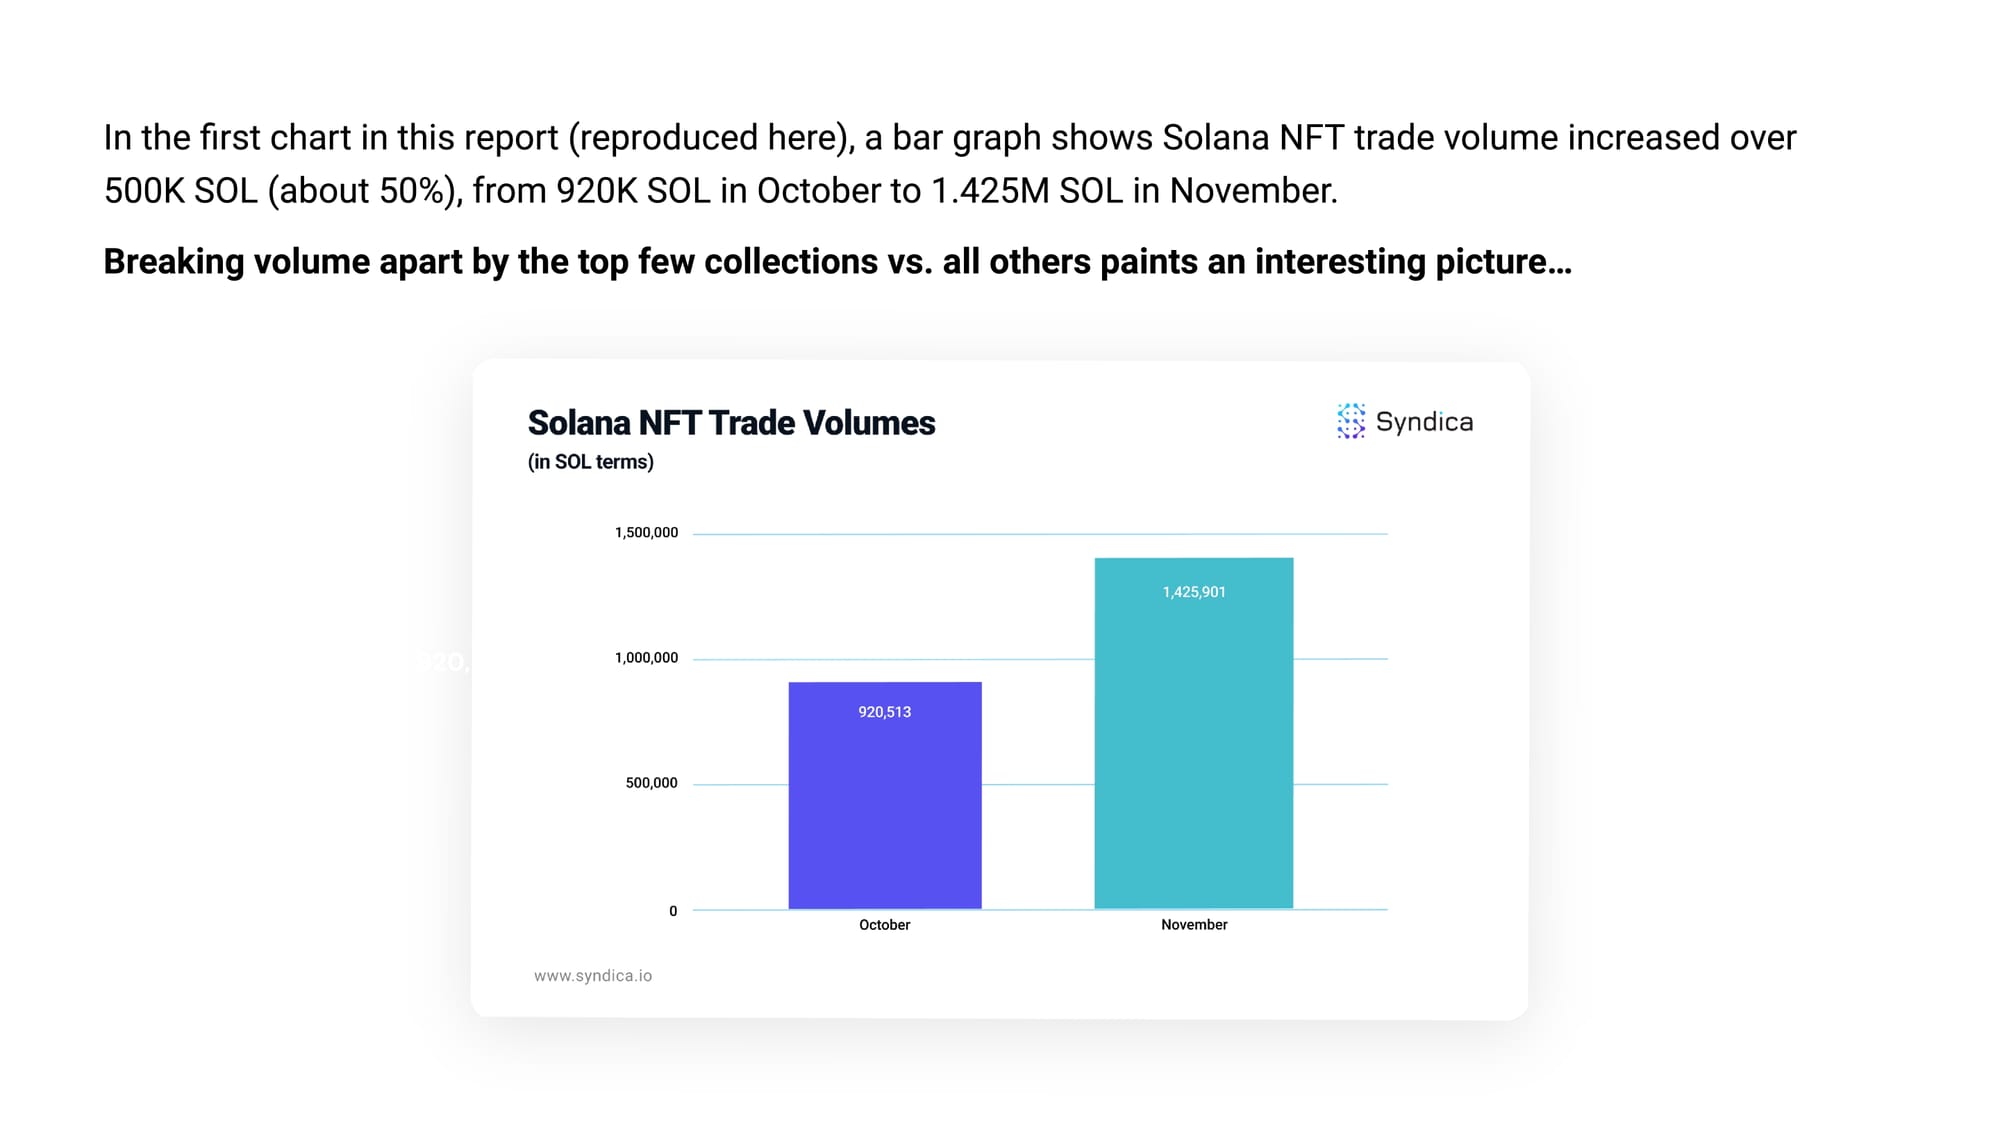
Solana NFT trade volumes grew over 50%, from about 920K SOL to 1,425K SOL.
Weekly Solana NFT USD volume increased 6x from roughly $750K to $4.5M (on secondary markets such as Tensor, Magic Eden, Sniper, and others).
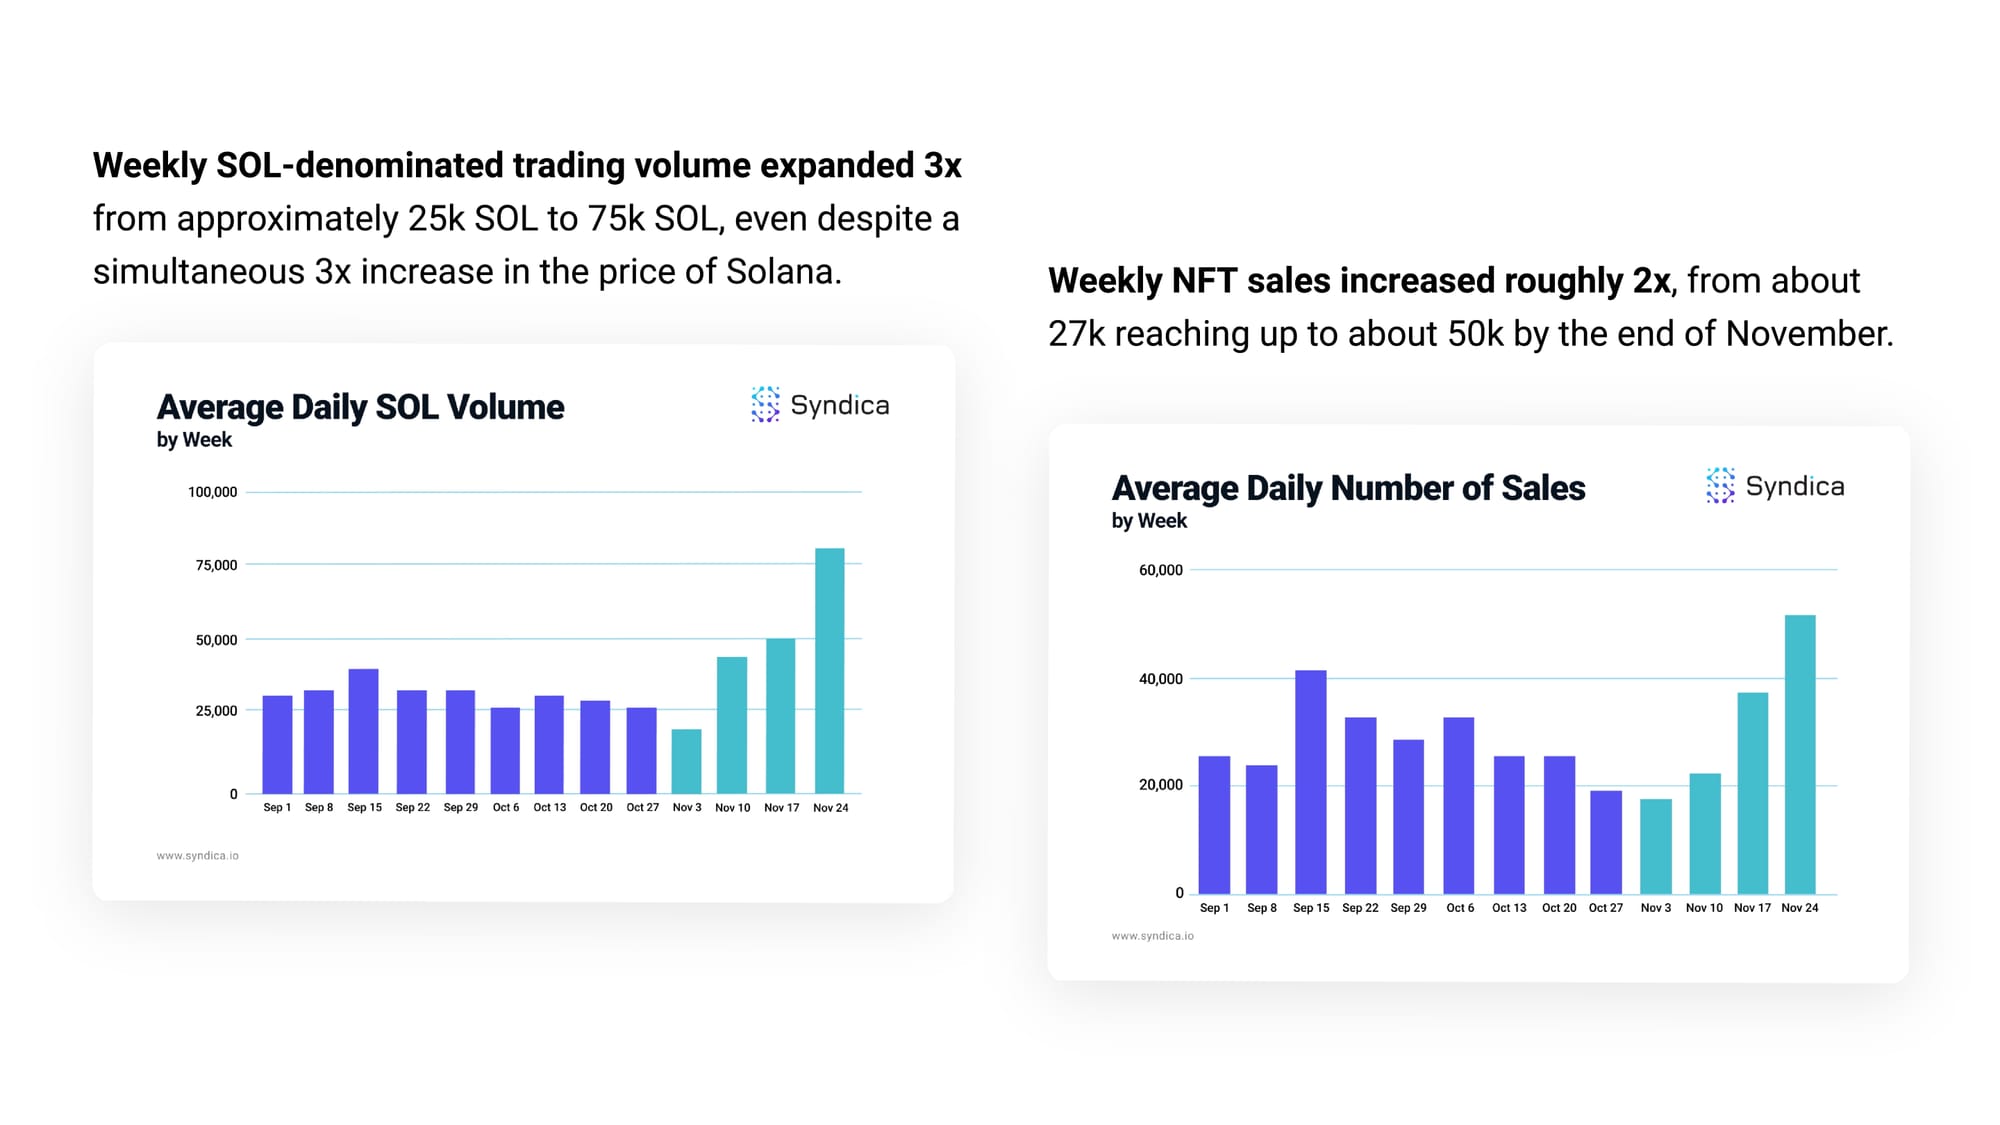
Weekly SOL-denominated trading volume expanded 3x from approximately 25k SOL to 75k SOL, even despite a simultaneous 3x increase in the price of Solana.
Weekly NFT sales increased roughly 2x, from about 27k reaching up to about 50k by the end of November.
Inflows into the Solana NFT ecosystem increased substantially in November, incoming mainly from:
A. Bridges
B. Centralized Exchanges
A. Bridges
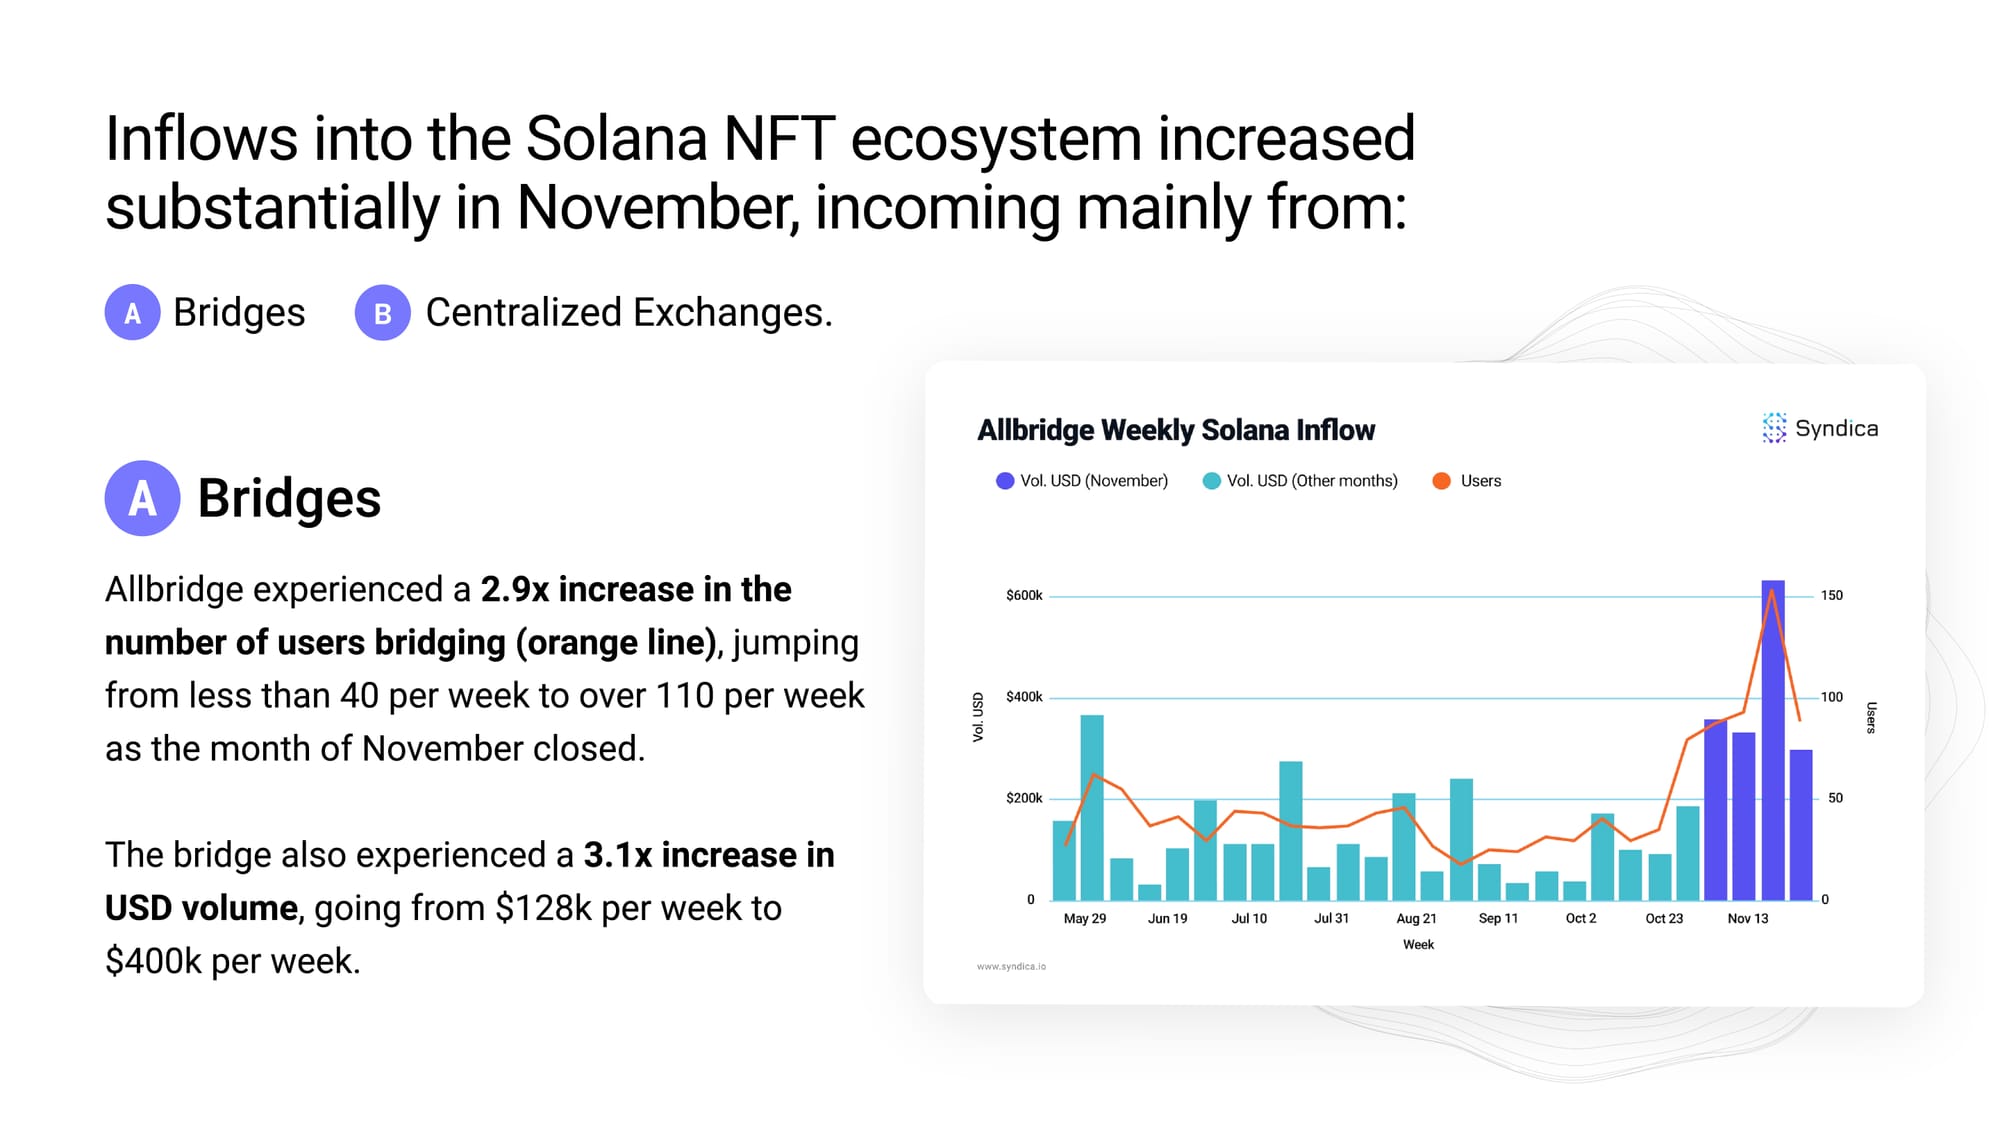
Allbridge experienced a 2.9x increase in the number of users bridging (orange line), jumping from less than 40 per week to over 110 per week as the month of November closed.
The bridge also experienced a 3.1x increase in USD volume, going from $128k per week to $400k per week.
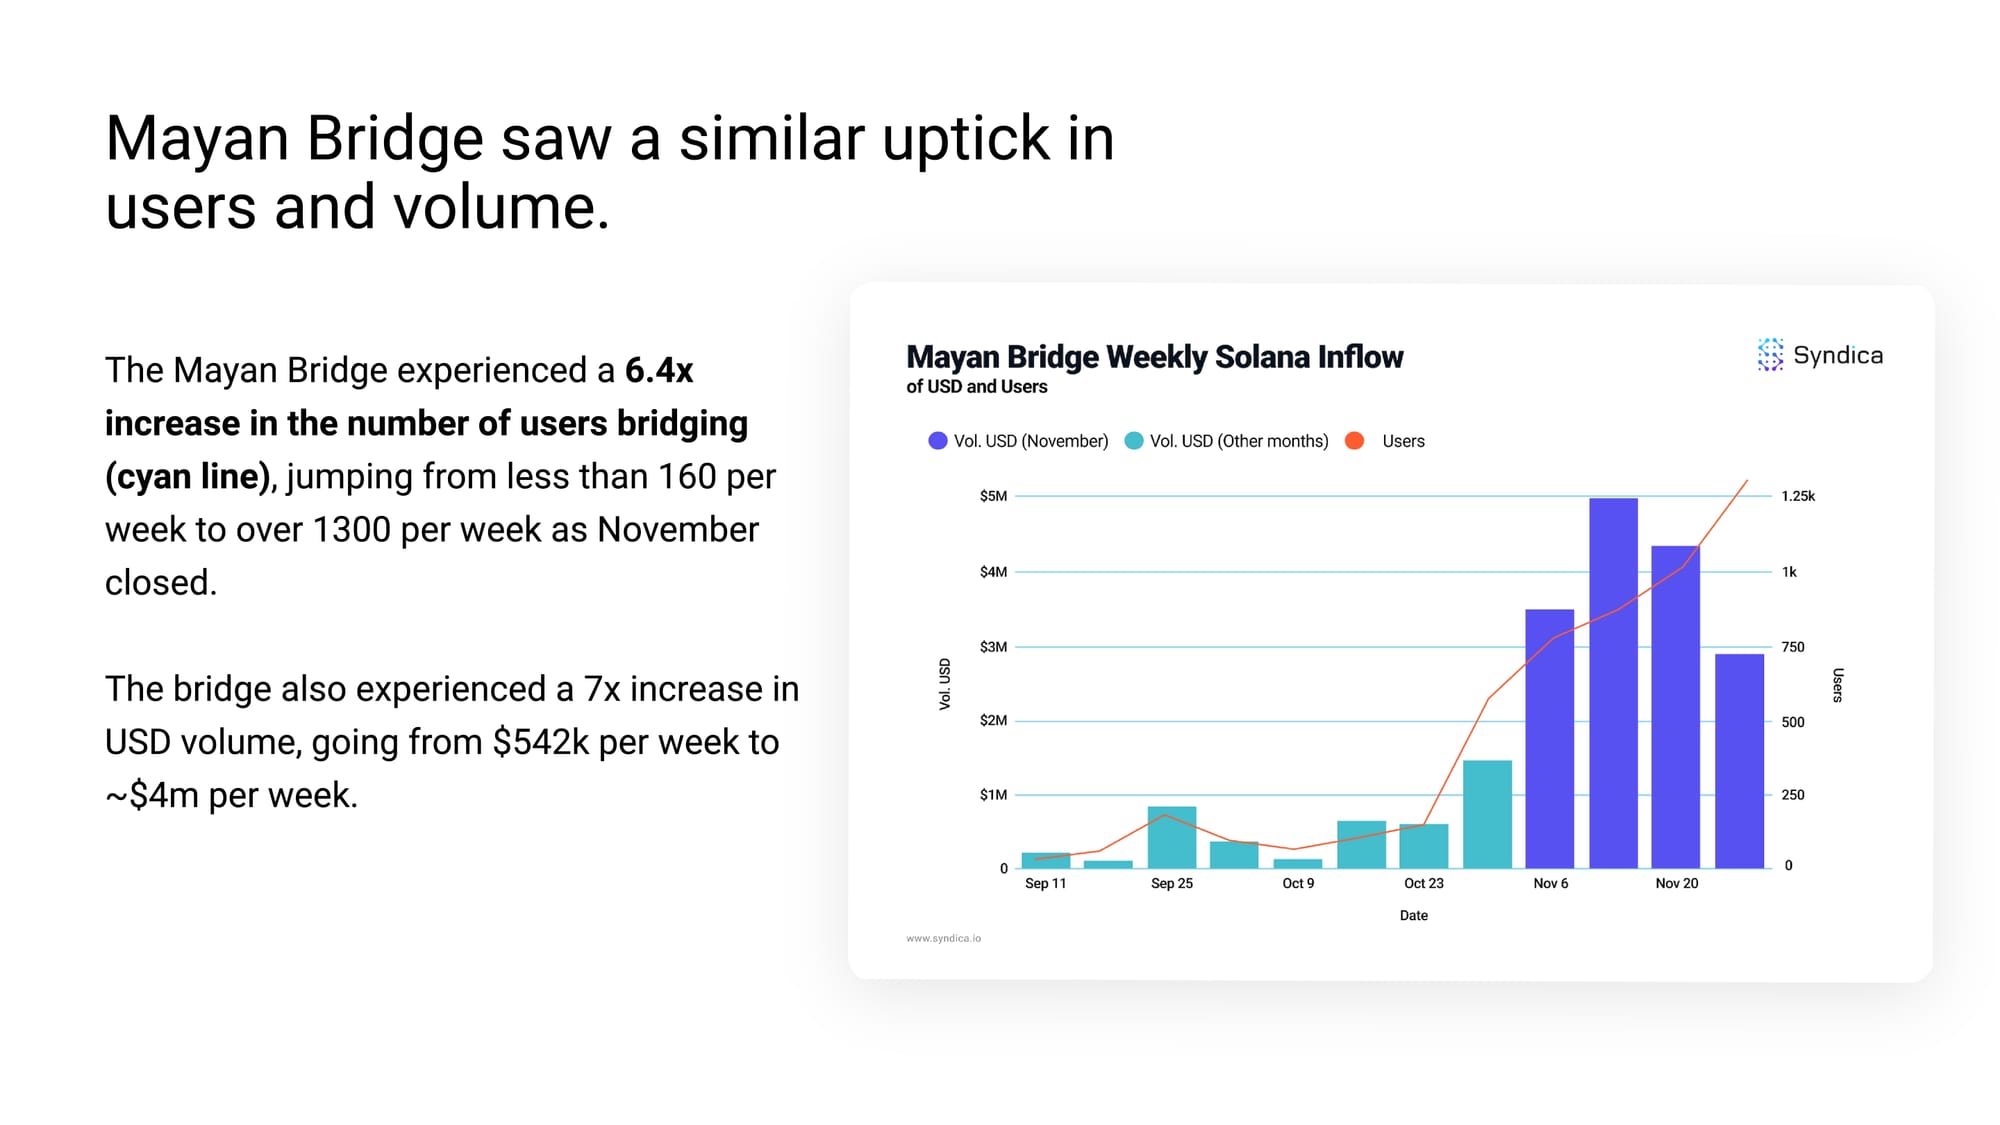
Mayan Bridge saw a similar uptick in users and volume.
The Mayan Bridge experienced a 6.4x increase in the number of users bridging (cyan line), jumping from less than 160 per week to over 1300 per week as November closed.
The bridge also experienced a 7x increase in USD volume, going from $542k per week to ~$4m per week.
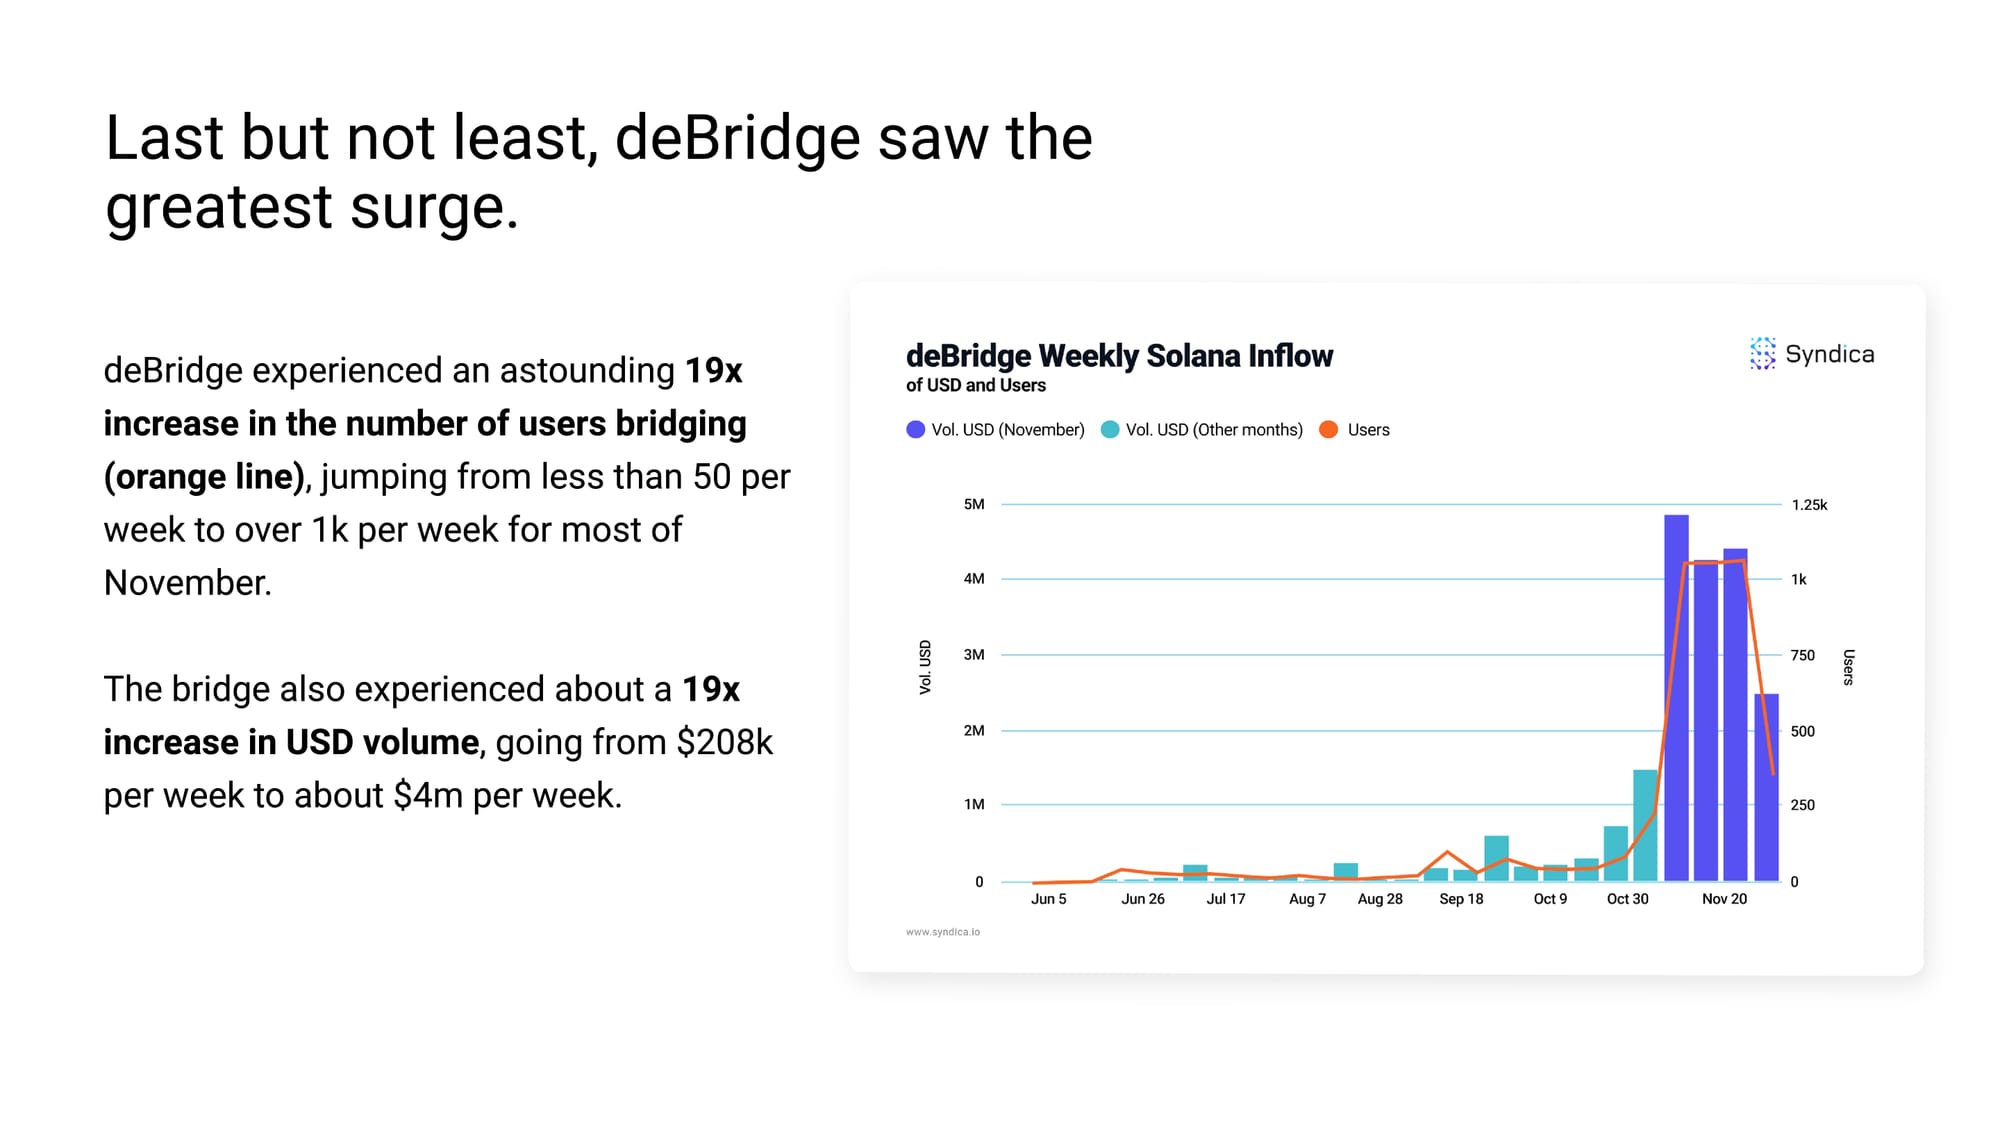
Last but not least, deBridge saw the greatest surge.
deBridge experienced an astounding 19x increase in the number of users bridging (orange line), jumping from less than 50 per week to over 1k per week for most of November.
The bridge also experienced about a 19x increase in USD volume, going from $208k per week to about $4m per week.
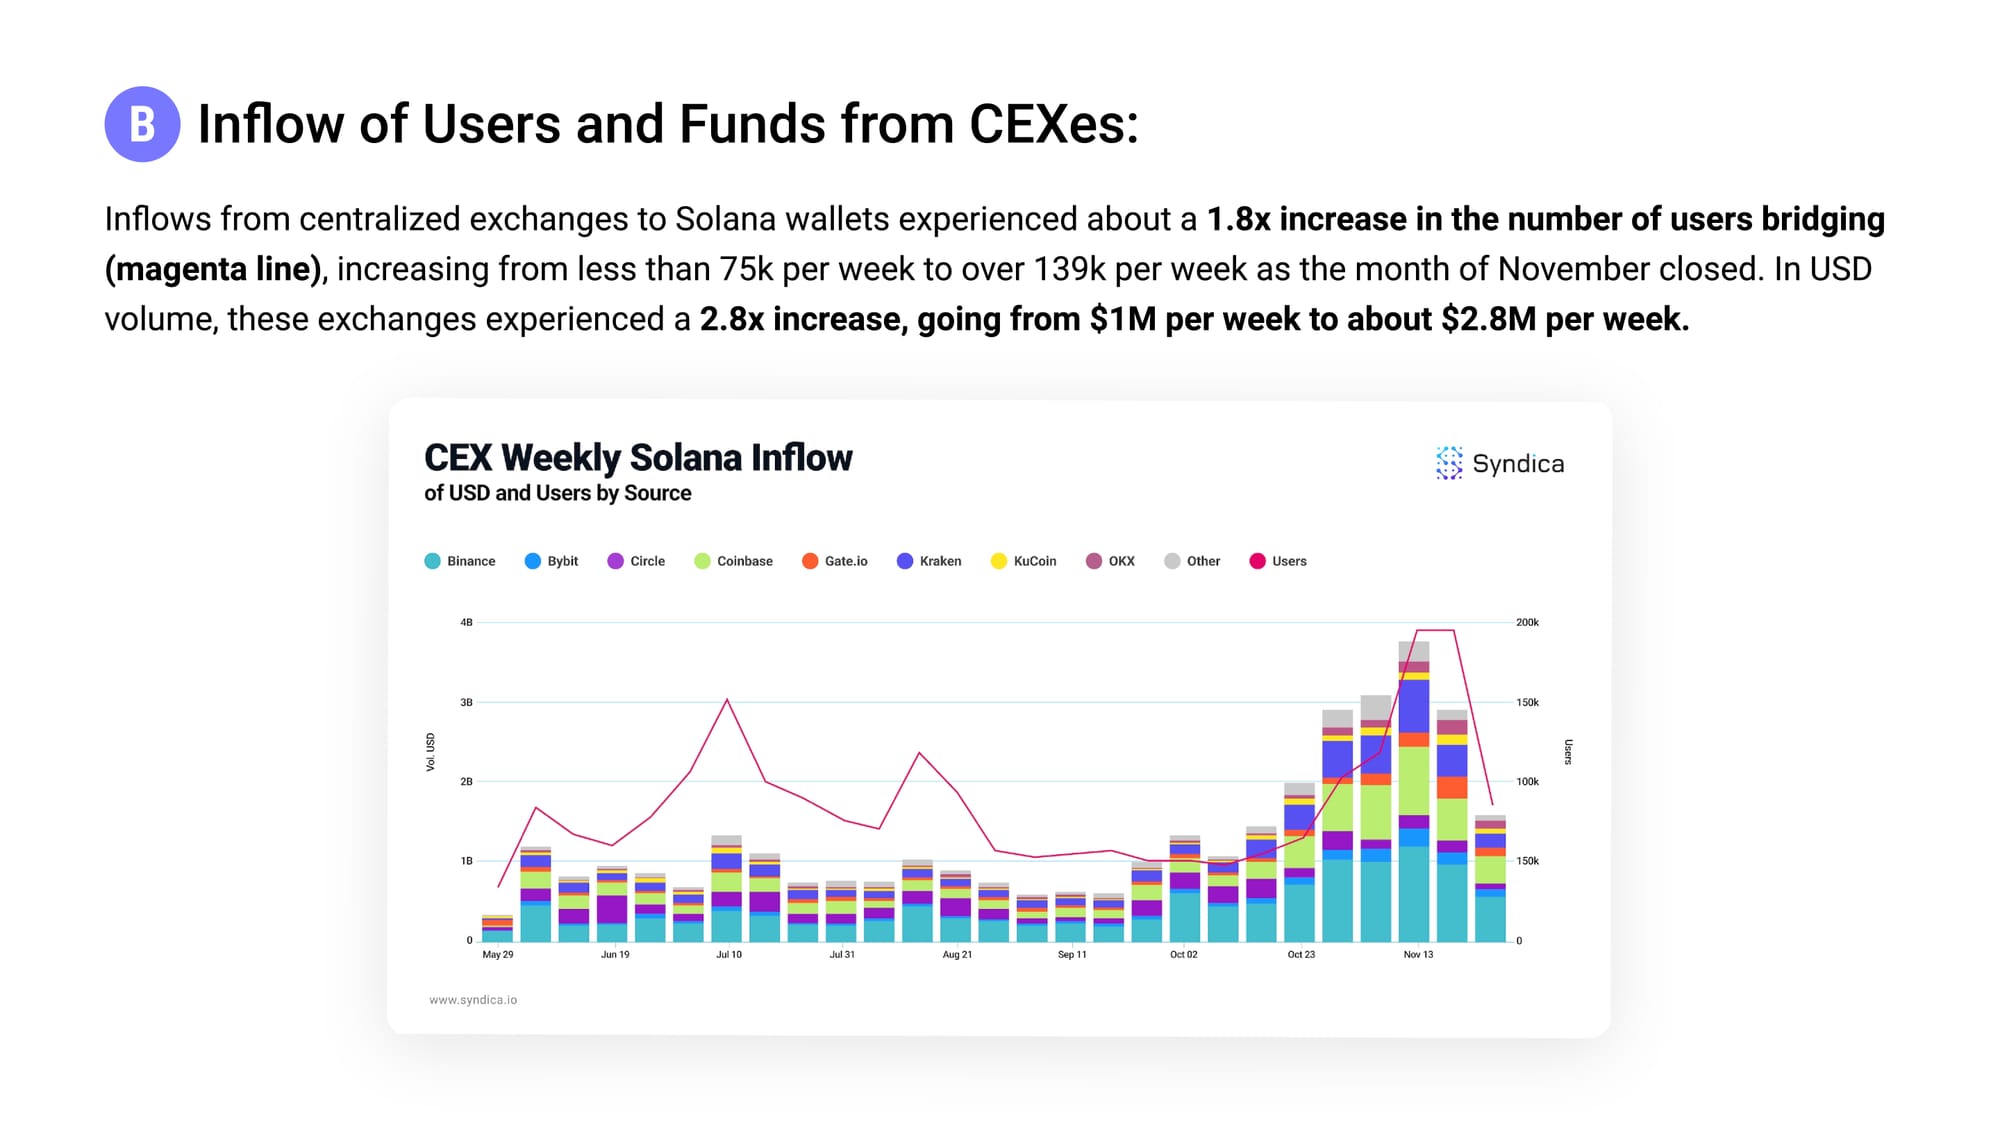
B. Inflow of Users and Funds from CEXes:
Inflows from centralized exchanges to Solana wallets experienced about a 1.8x increase in the number of users bridging (magenta line), increasing from less than 75k per week to over 139k per week as the month of November closed. In USD volume, these exchanges experienced a 2.8x increase, going from $1M per week to about $2.8M per week.
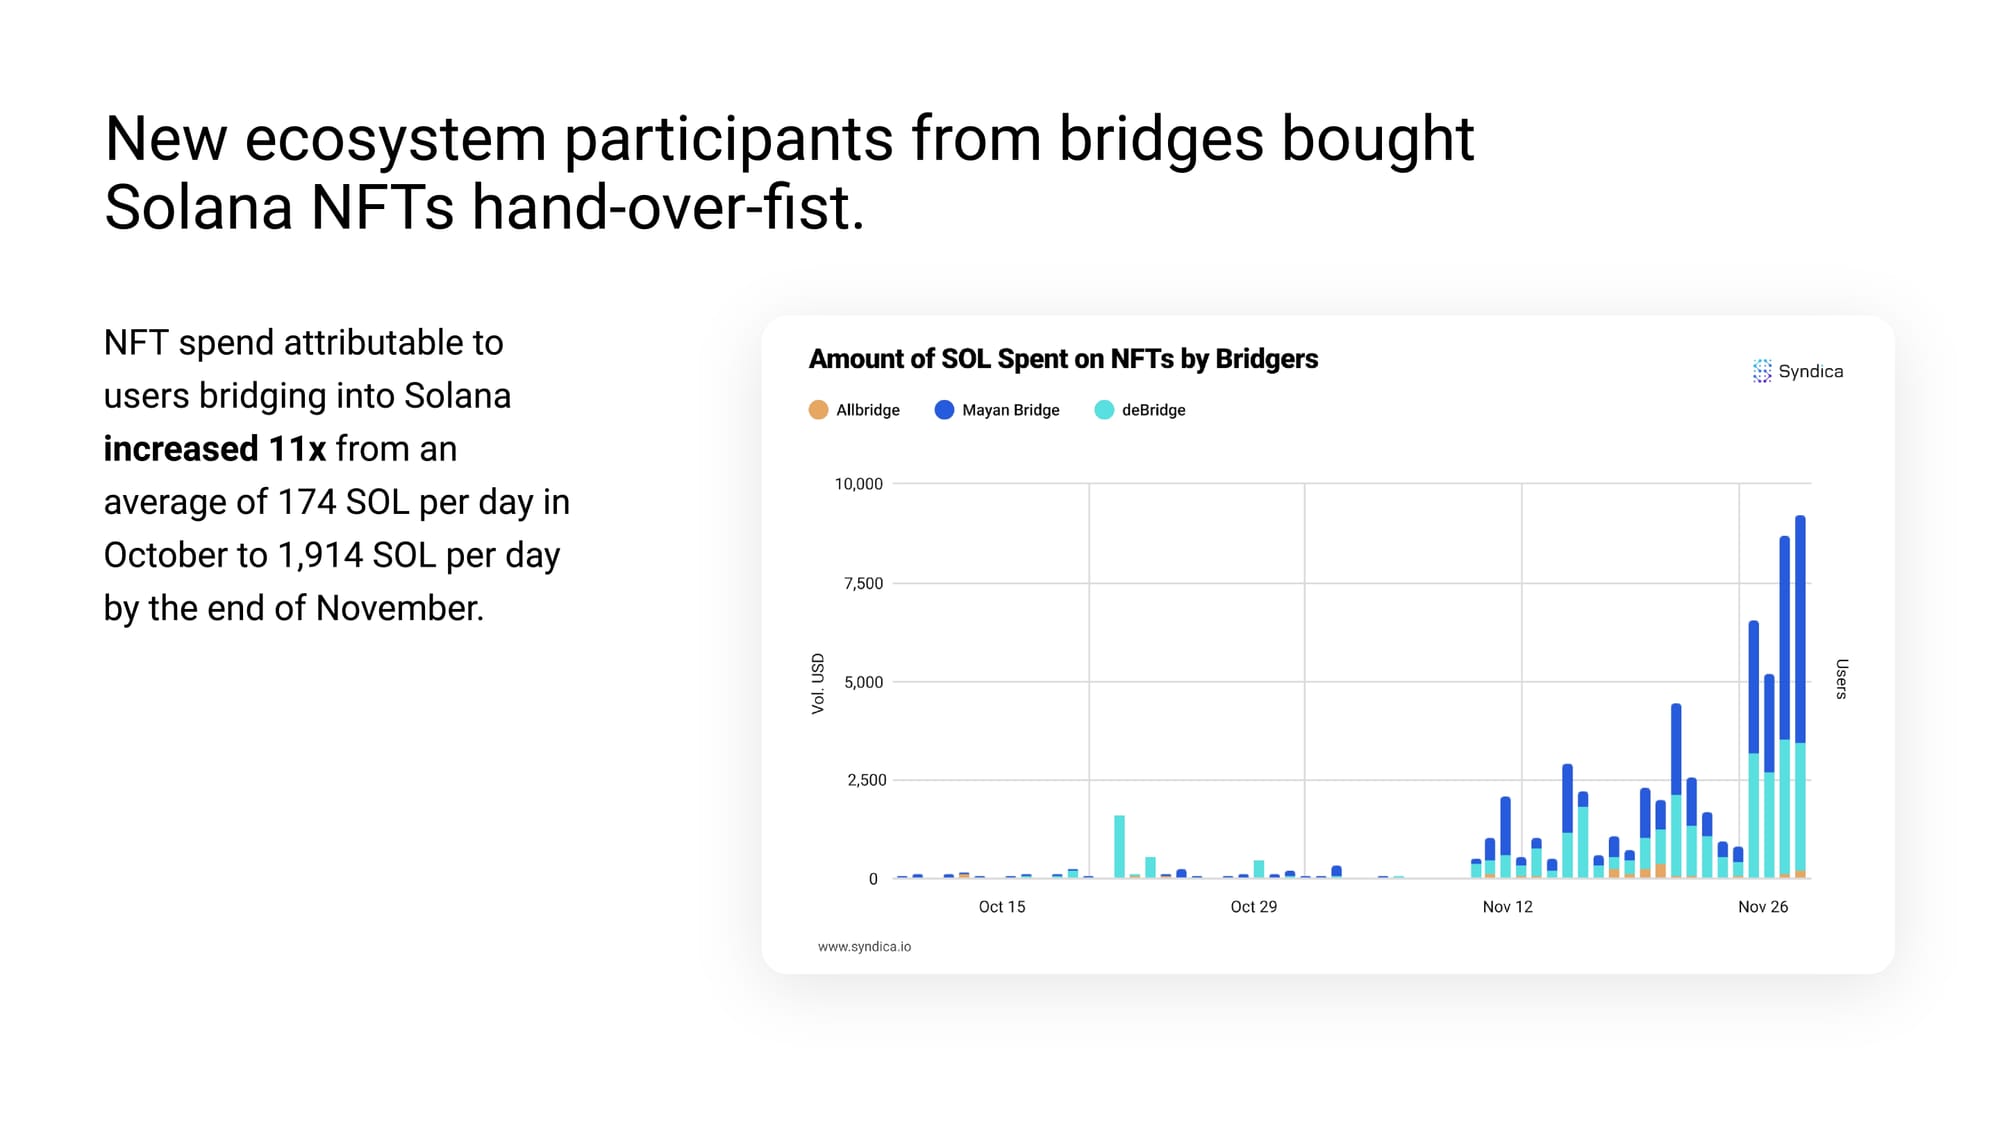
New ecosystem participants from bridges bought Solana NFTs hand-over-fist.
NFT spend attributable to users bridging into Solana increased 11x from an average of 174 SOL per day in October to 1,914 SOL per day by the end of November.
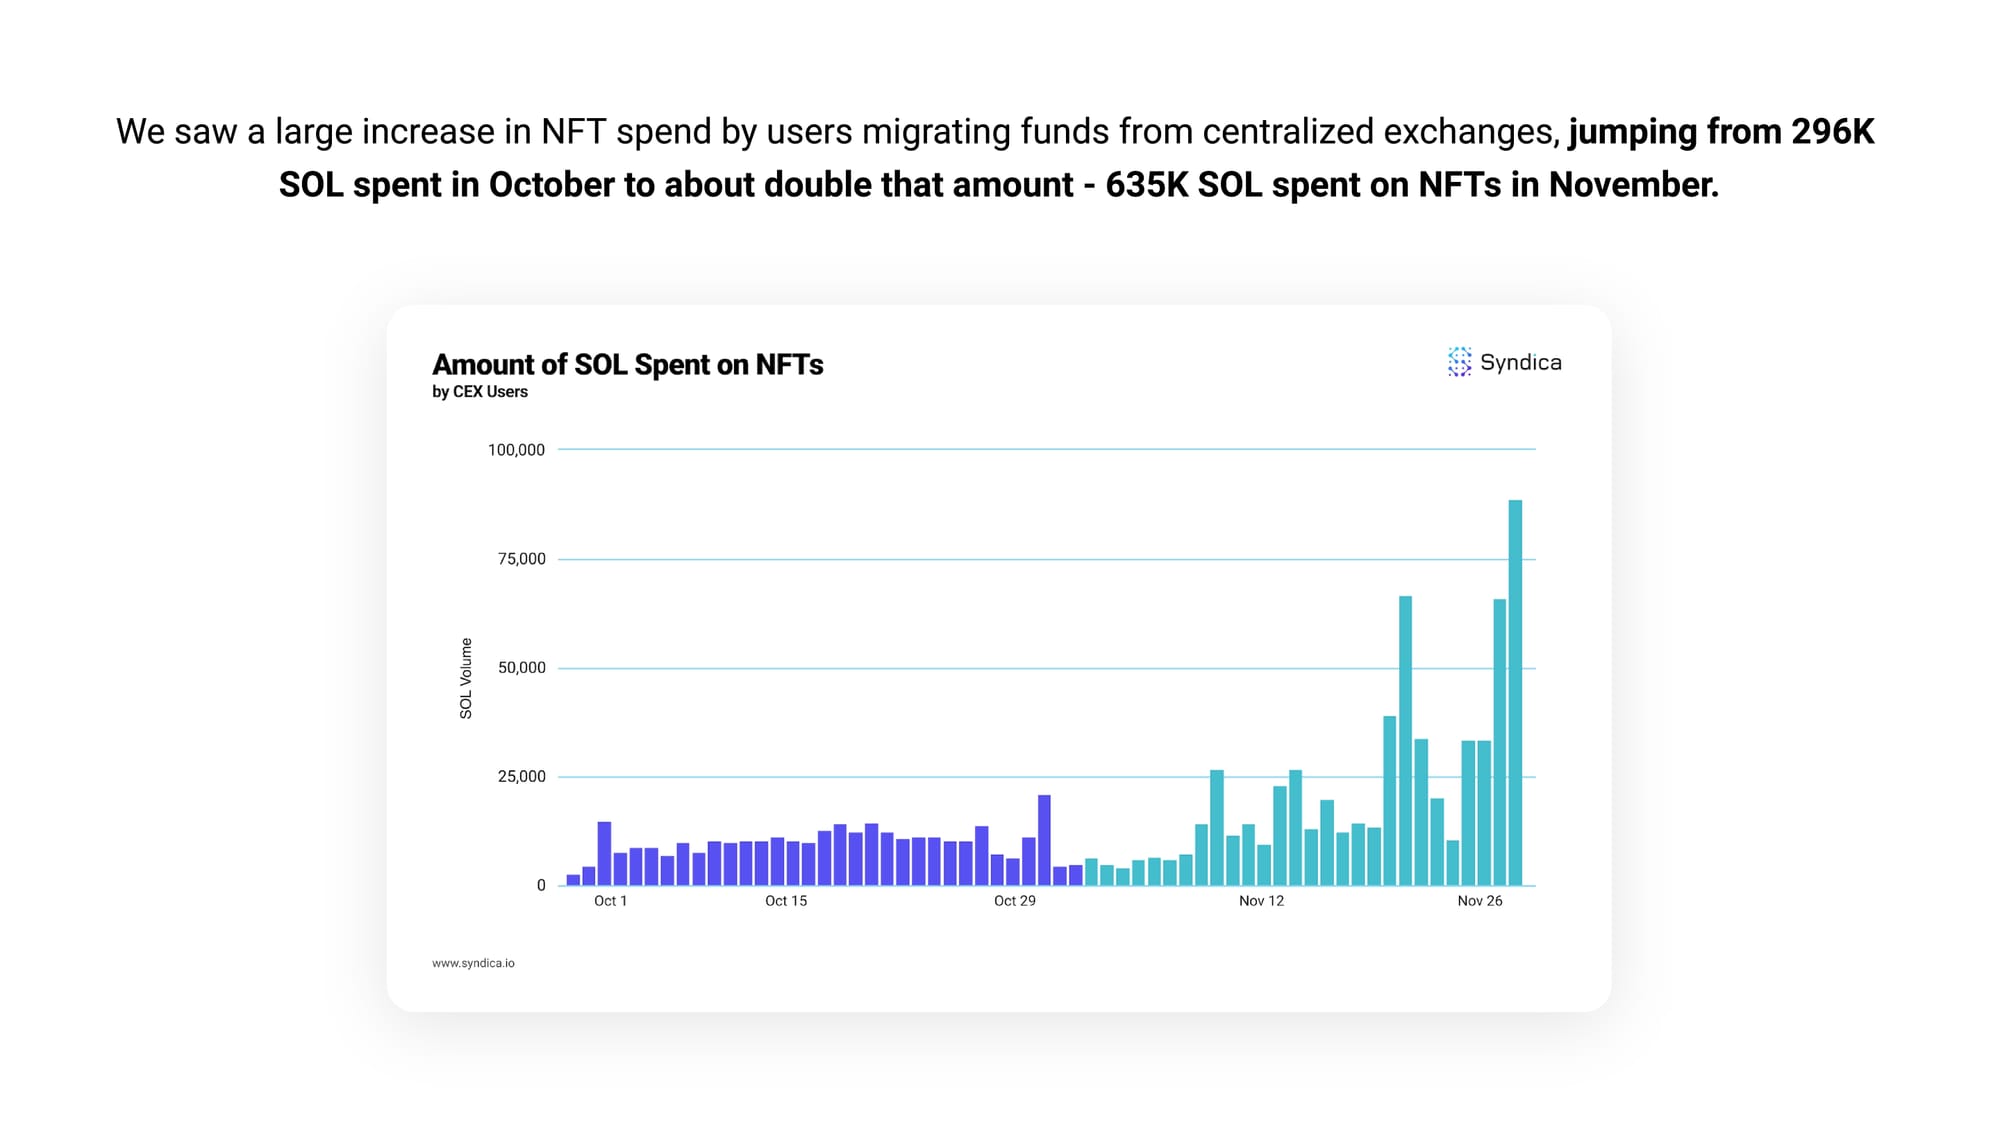
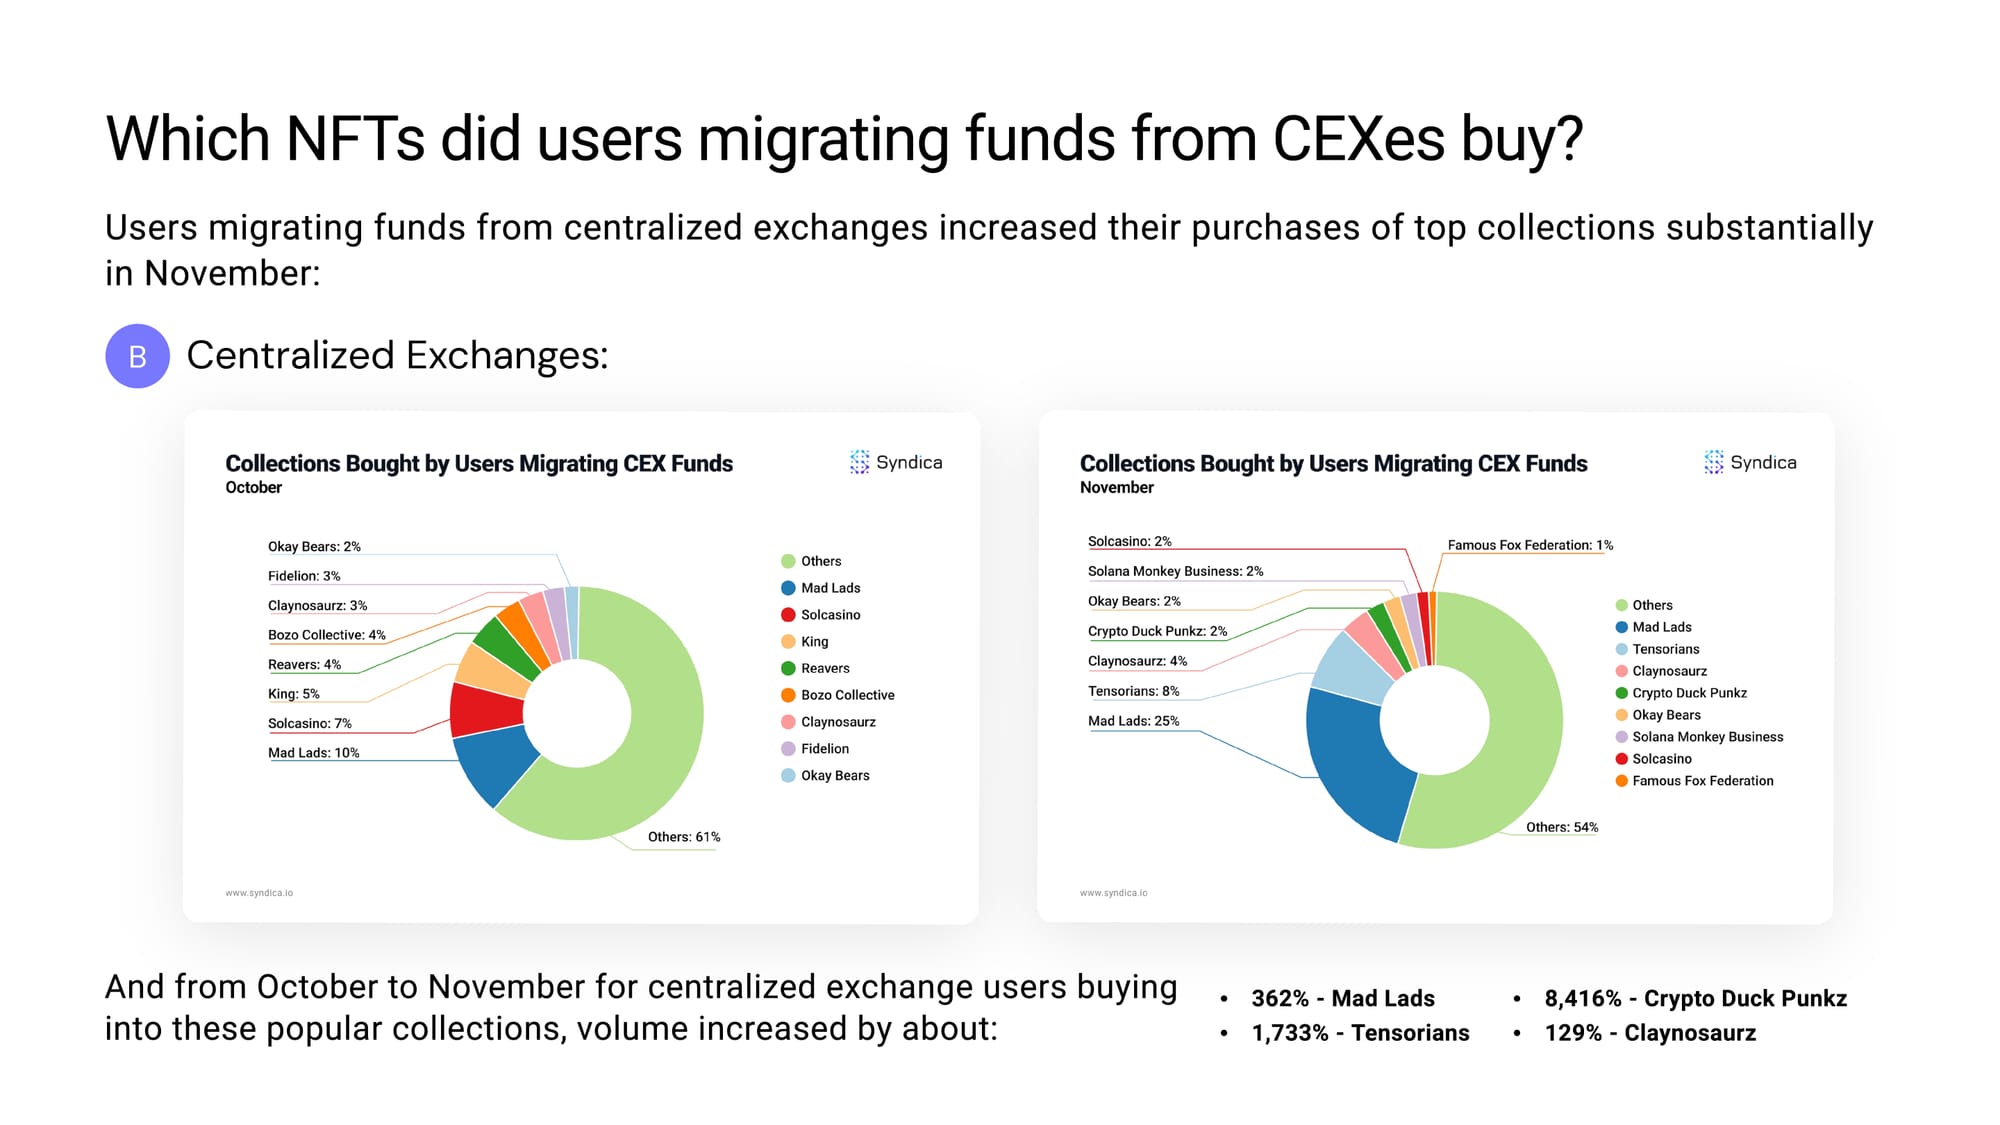
We saw a large increase in NFT spend by users migrating funds from centralized exchanges, jumping from 296K SOL spent in October to about double that amount - 635K SOL spent on NFTs in November.
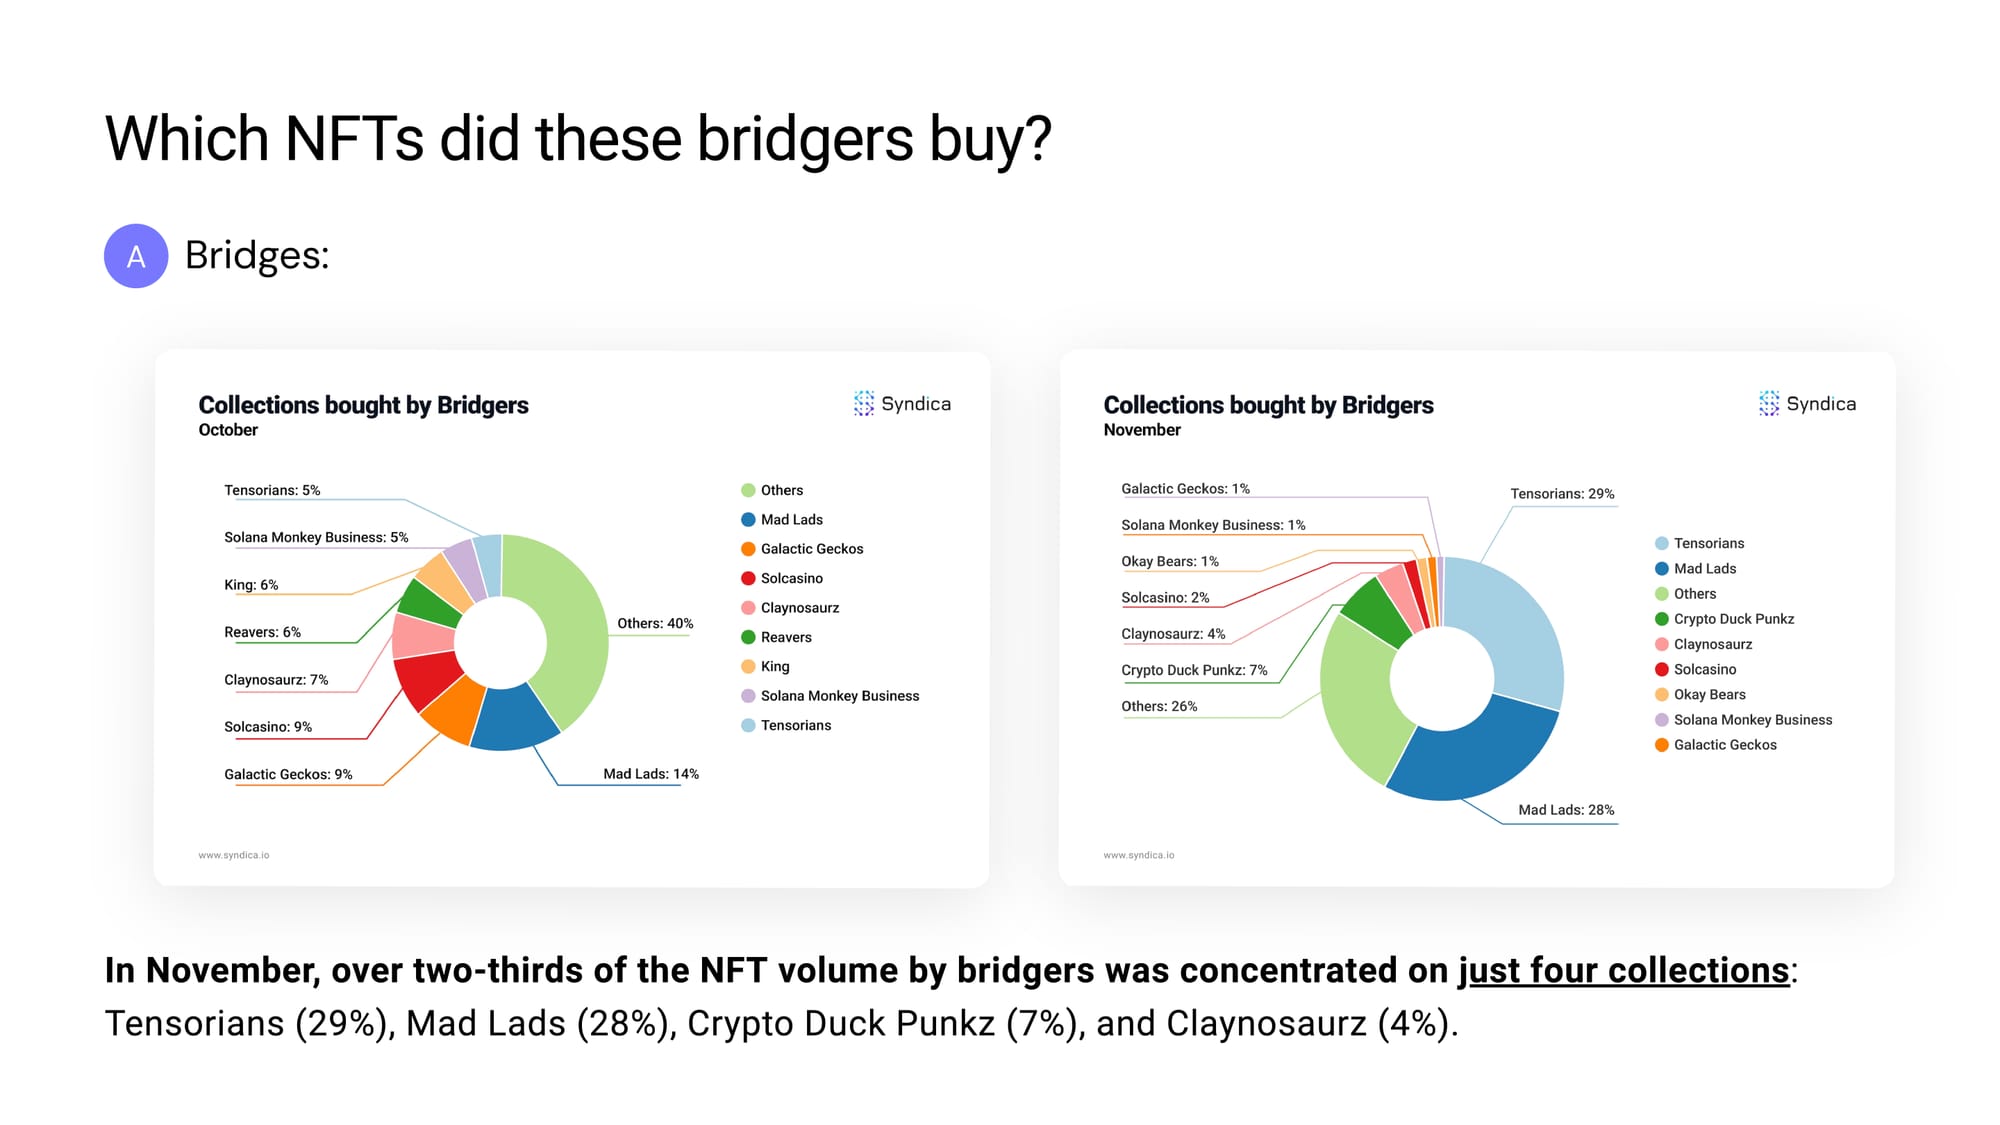
Which NFTs did these bridgers buy?
In November, over two-thirds of the NFT volume by bridgers was concentrated on just four collections: Tensorians (29%), Mad Lads (28%), Crypto Duck Punkz (7%), and Claynosaurz (4%).
Which NFTs did users migrating funds from CEXes buy?
Users migrating funds from centralized exchanges increased their purchases of top collections substantially in November.
And from October to November for centralized exchange users buying into these popular collections, volume increased by about:
- 362% - Mad Lads
- 1,733% - Tensorians
- 8,416% - Crypto Duck Punkz
- 129% - Claynosaurz
In the first chart in this report (reproduced here), a bar graph shows Solana NFT trade volume increased over 500K SOL (about 50%), from 920K SOL in October to 1.425M SOL in November.
Breaking volume apart by the top few collections vs. all others paints an interesting picture…
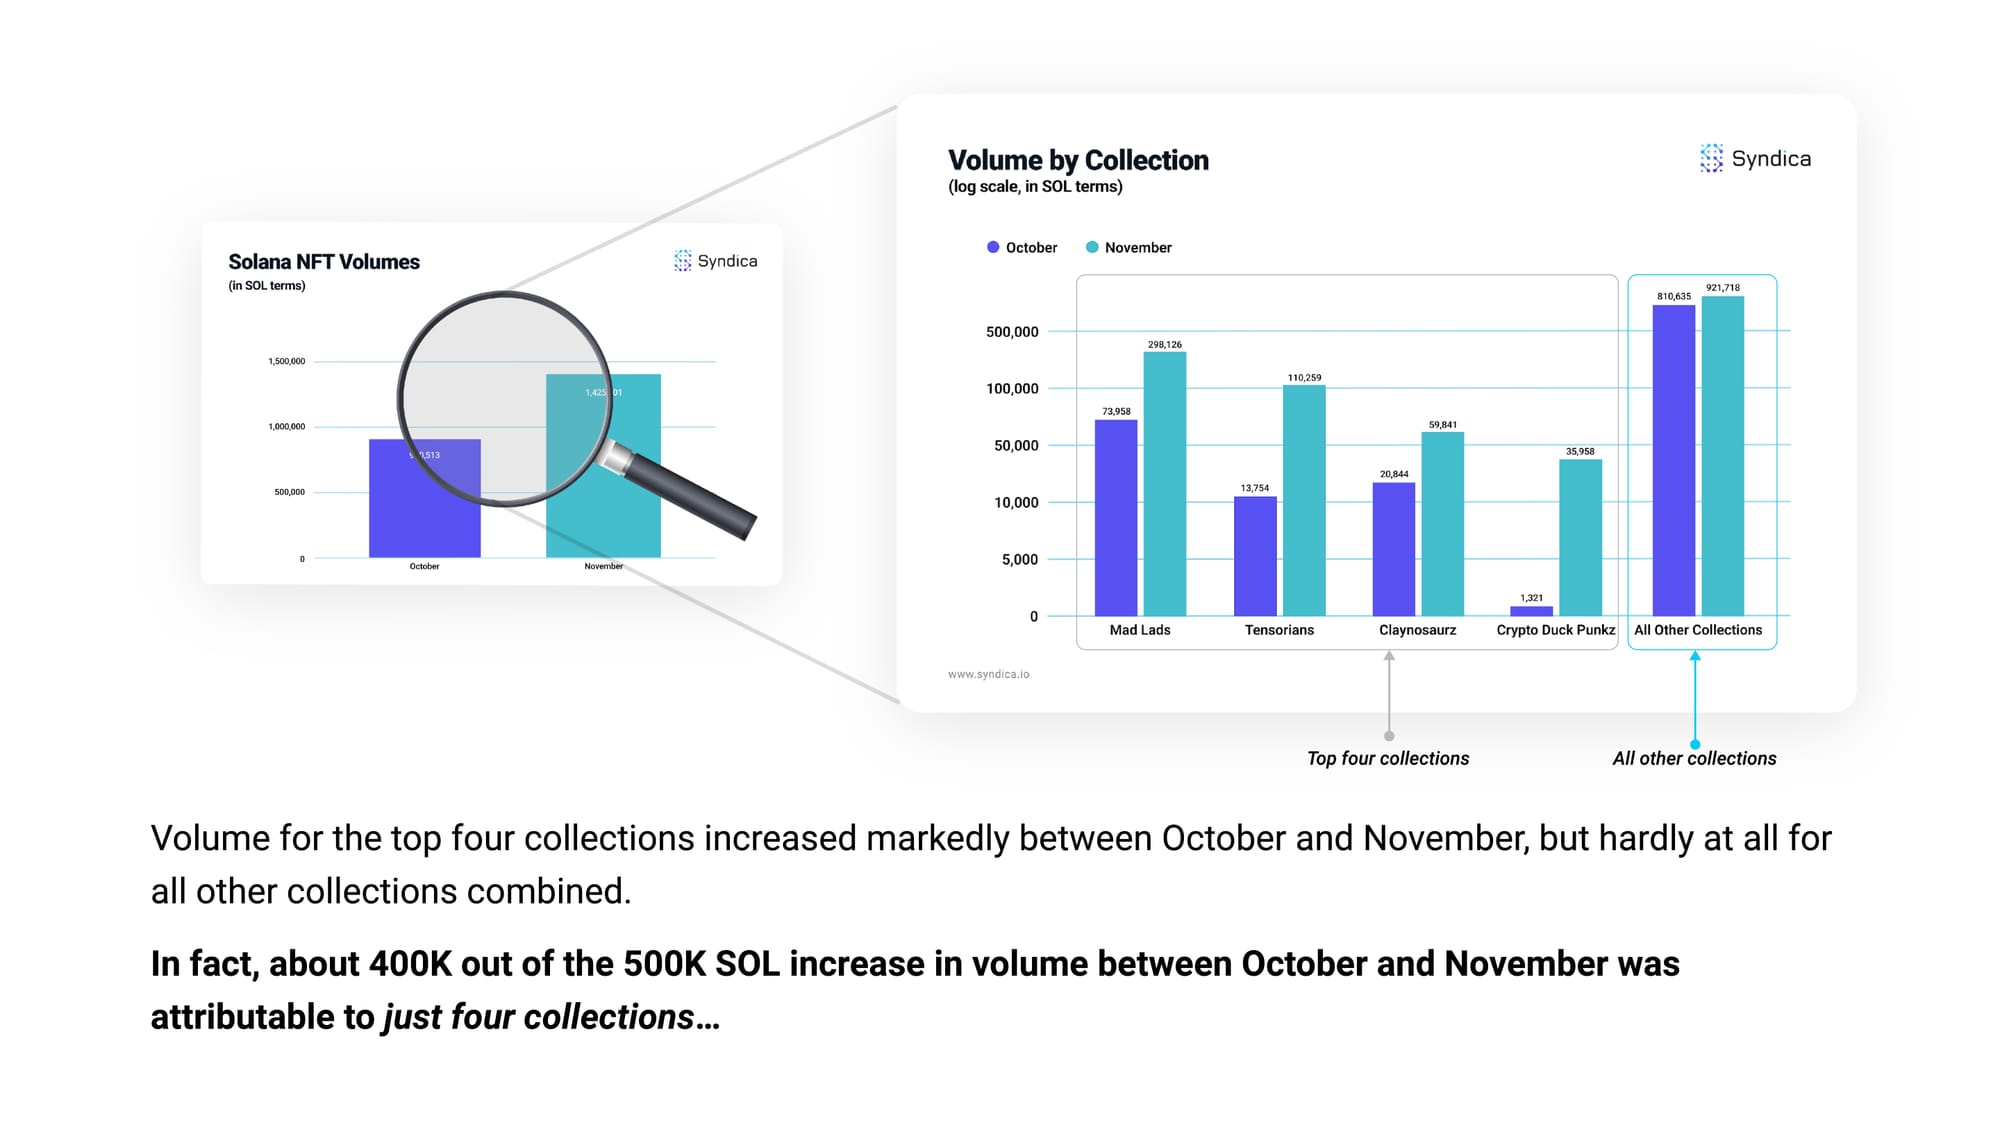
Volume for the top four collections increased markedly between October and November, but hardly at all for all other collections combined.
In fact, about 400K out of the 500K SOL increase in volume between October and November was attributable to just four collections…
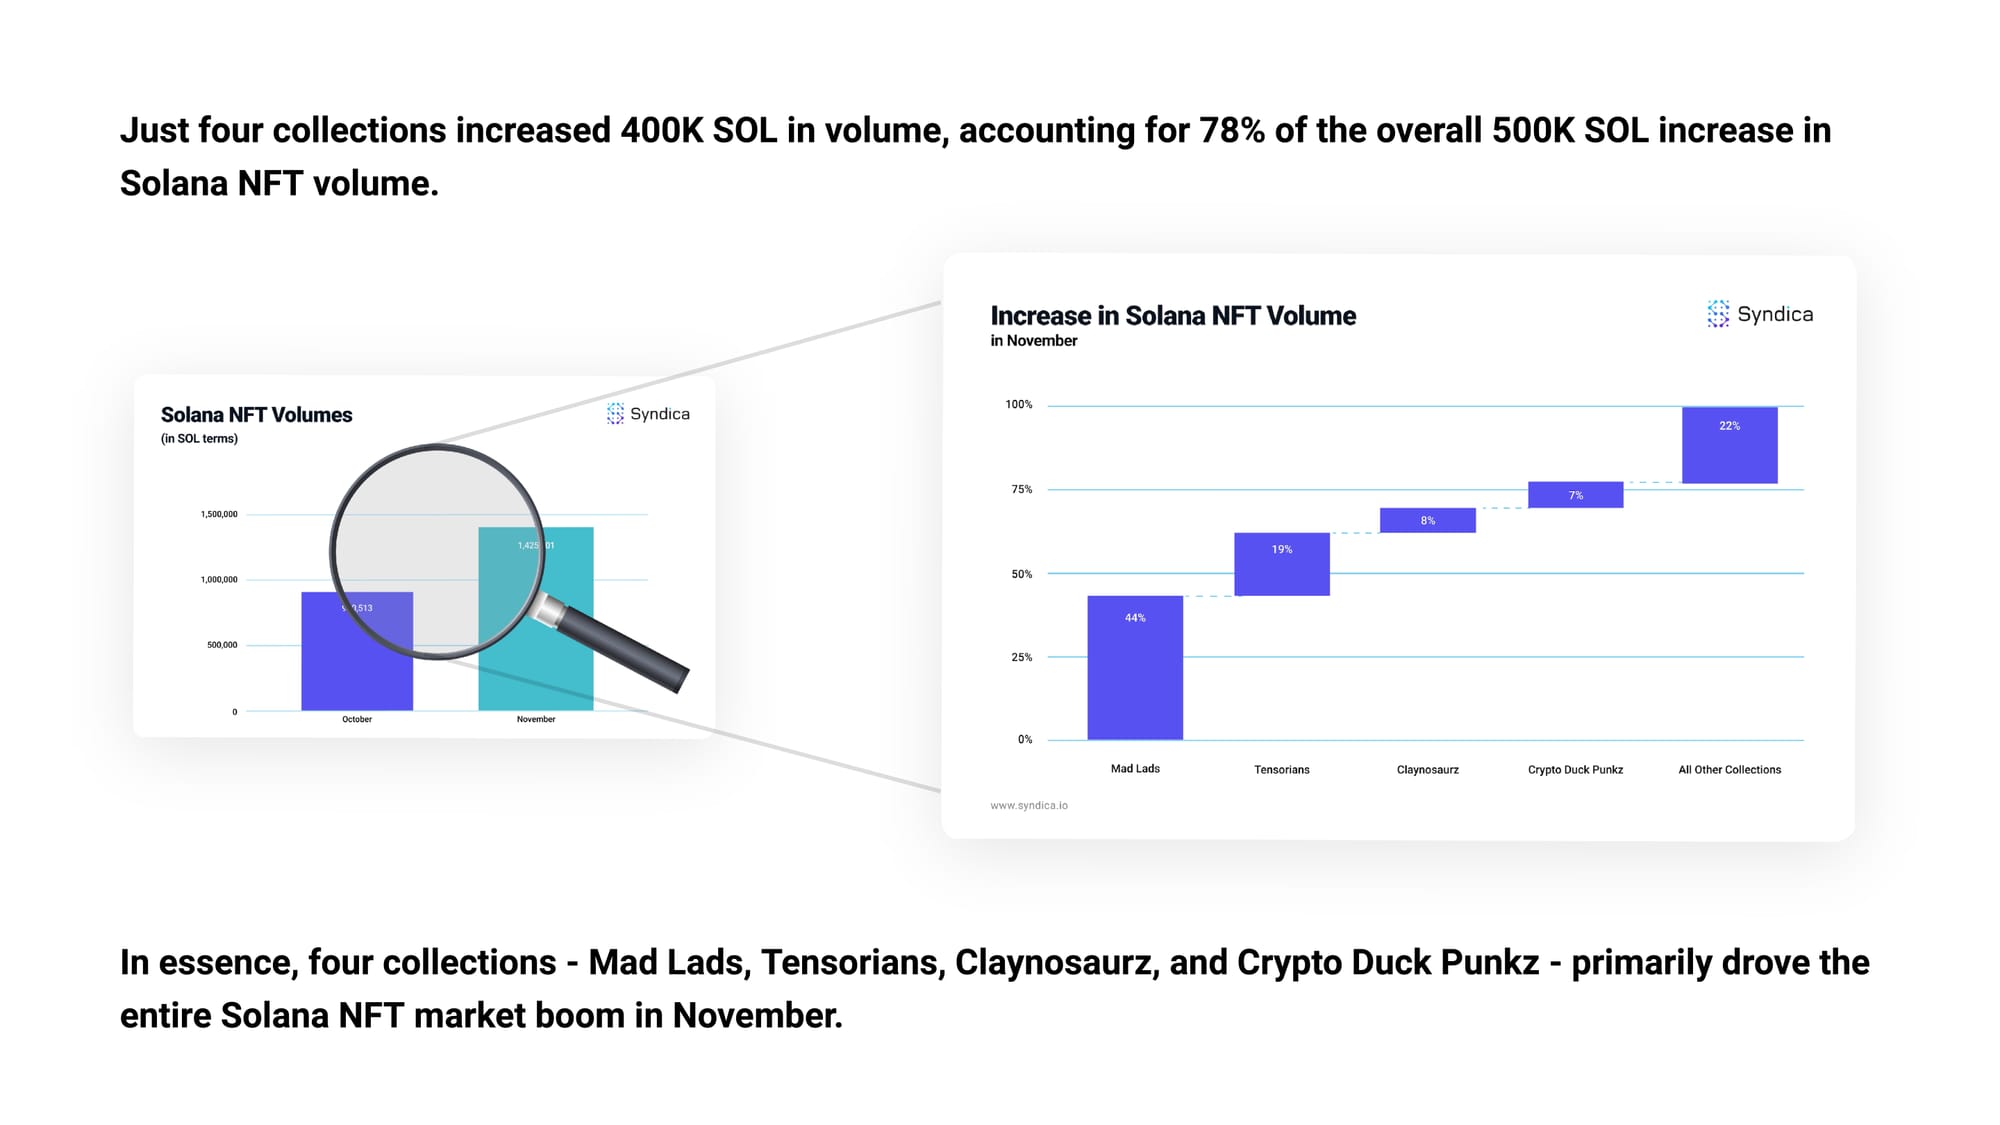
Just four collections increased 400K SOL in volume, accounting for 78% of the overall 500K SOL increase in Solana NFT volume.
In essence, four collections - Mad Lads, Tensorians, Claynosaurz, and Crypto Duck Punkz - primarily drove the entire Solana NFT market boom in November.
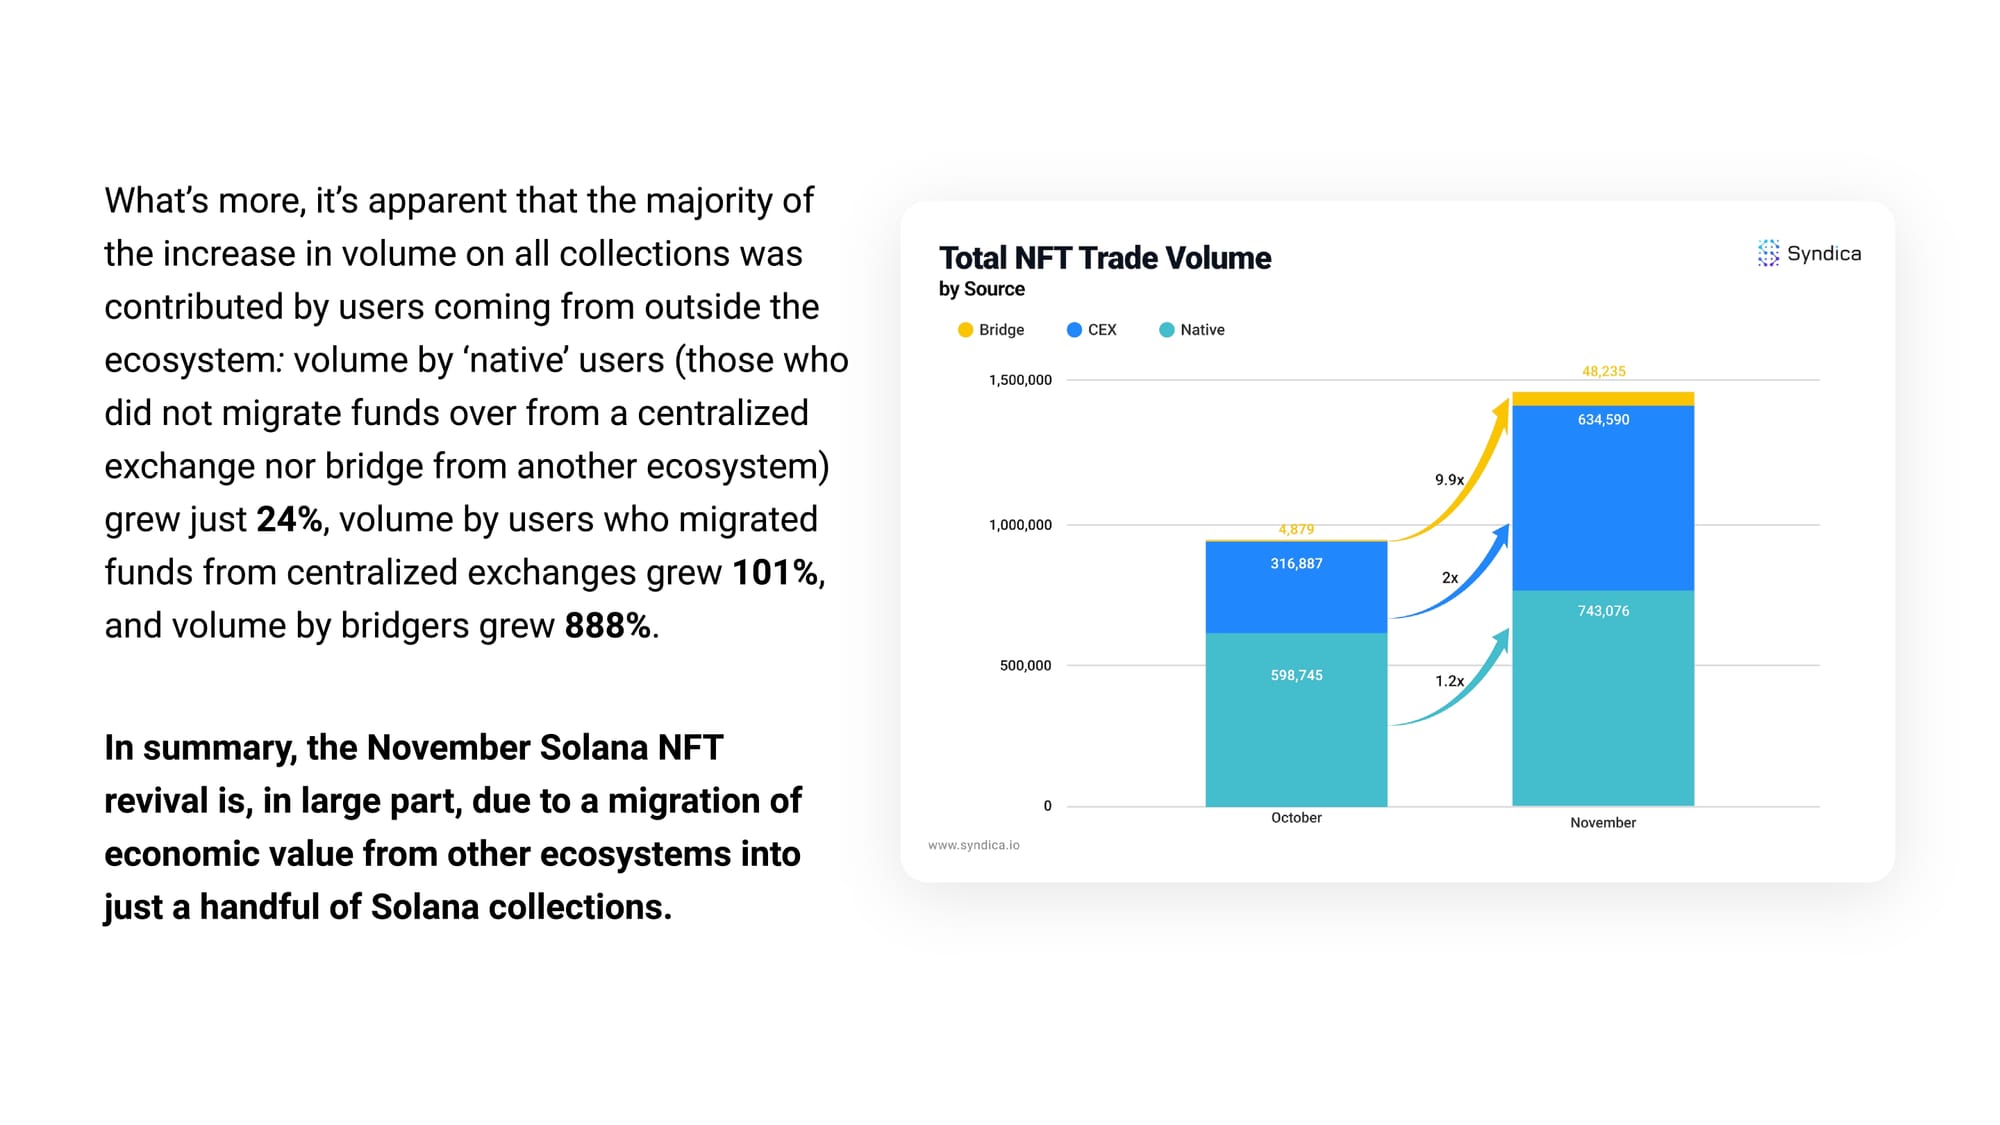
What’s more, it’s apparent that the majority of the increase in volume on all collections was contributed by users coming from outside the ecosystem: volume by ‘native’ users (those who did not migrate funds over from a centralized exchange nor bridge from another ecosystem) grew just 24%, volume by users who migrated funds from centralized exchanges grew 101%, and volume by bridgers grew 888%.
In summary, the November Solana NFT revival is, in large part, due to a migration of economic value from other ecosystems into just a handful of Solana collections.
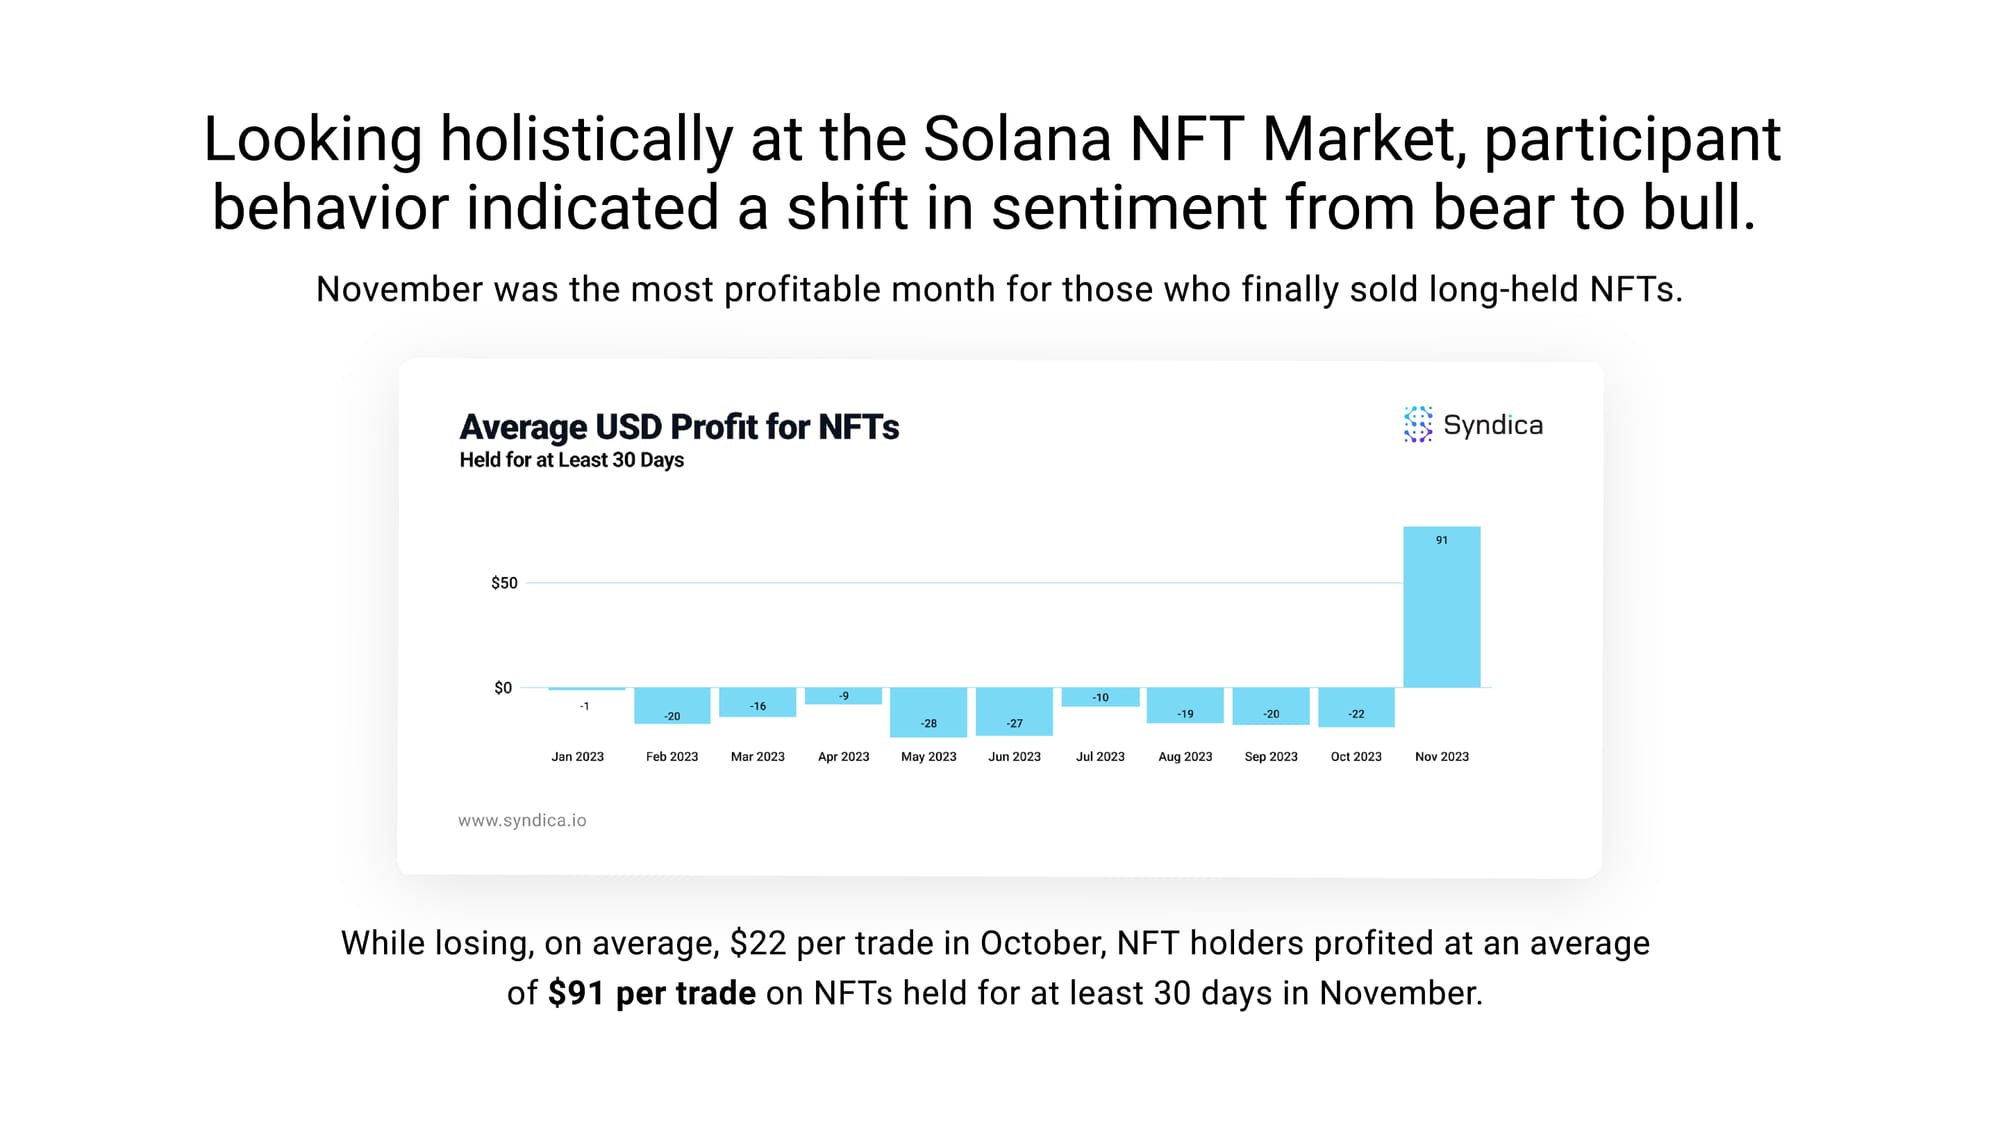
Looking holistically at the Solana NFT Market, participant behavior indicated a shift in sentiment from bear to bull.
November was the most profitable month for those who finally sold long-held NFTs.
While losing, on average, $22 per trade in October, NFT holders profited at an average of $91 per trade on NFTs held for at least 30 days in November.
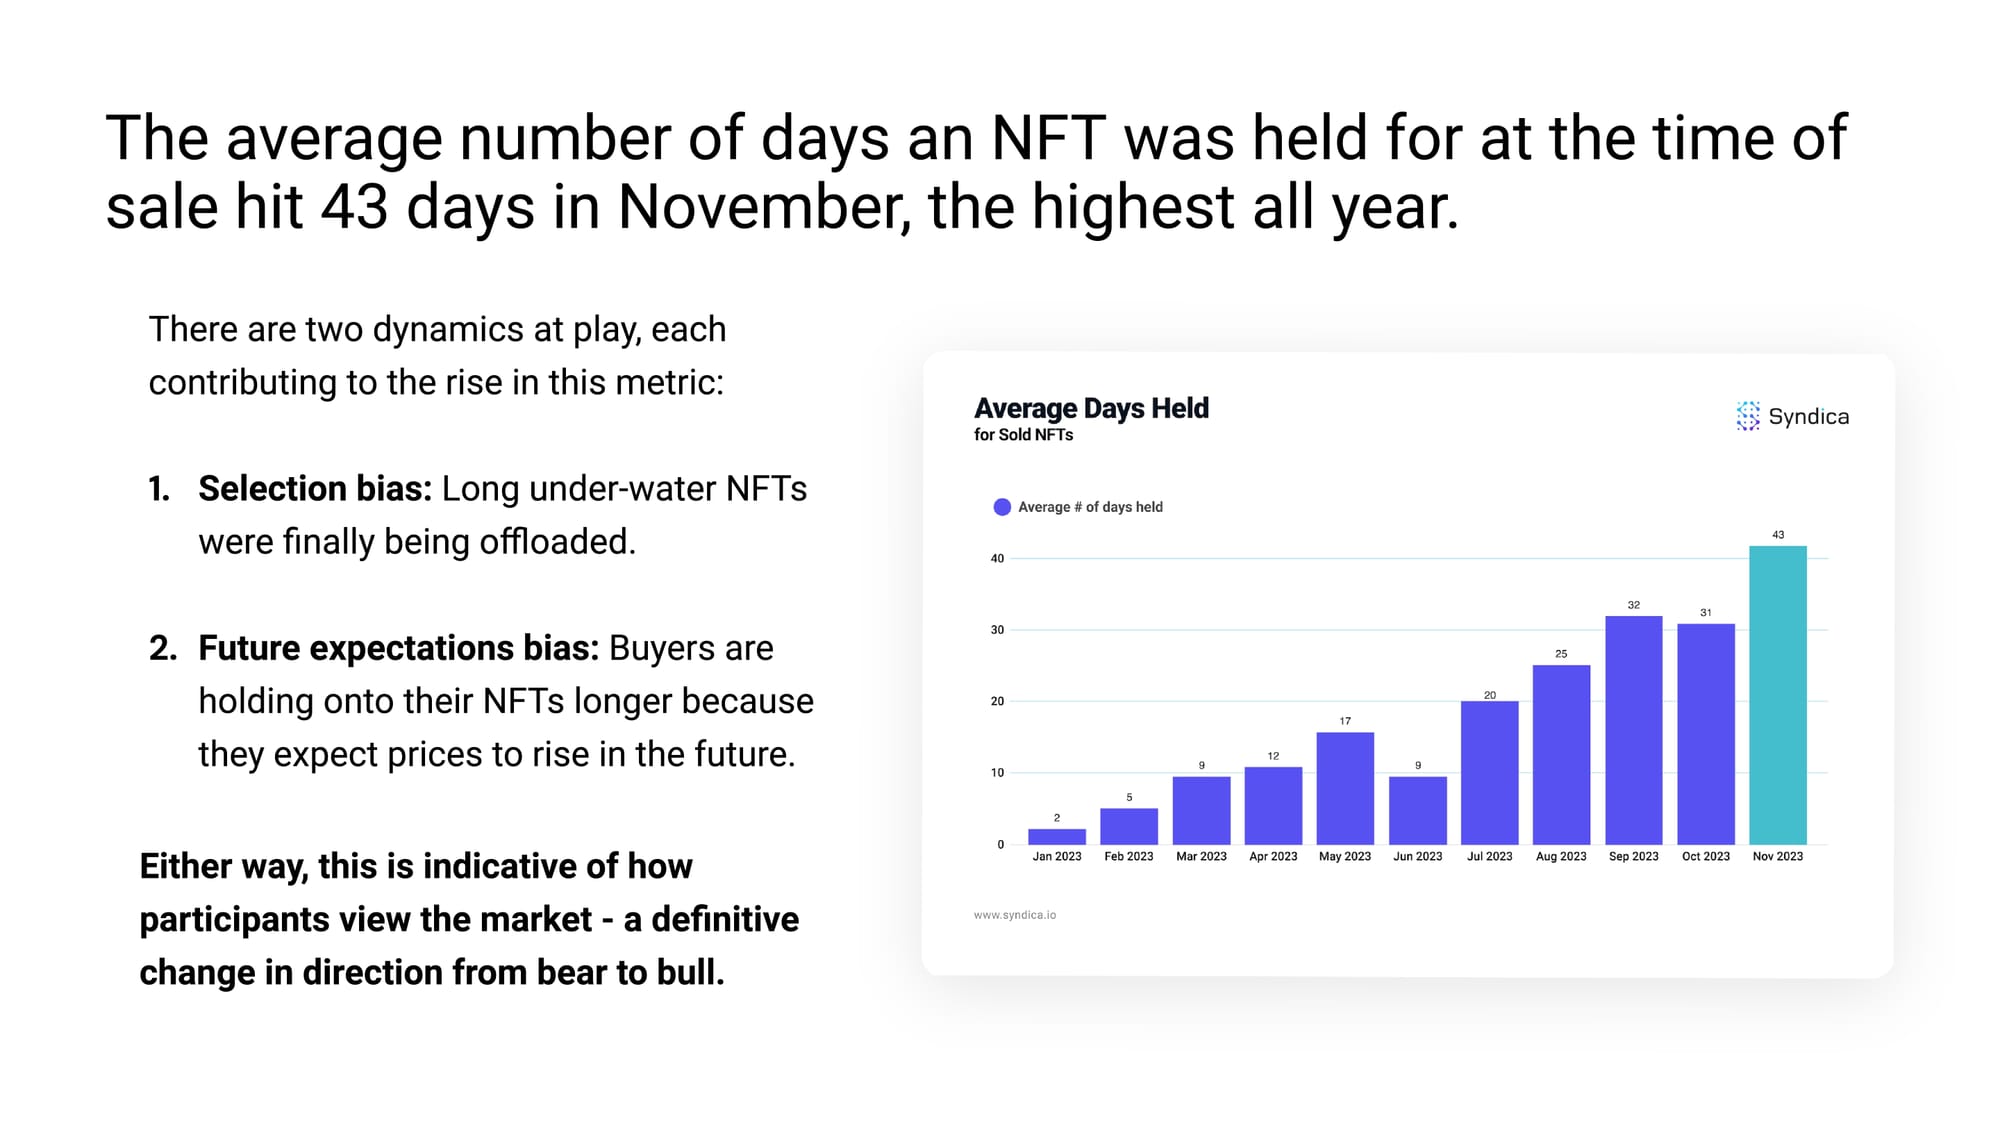
The average number of days an NFT was held for at the time of sale hit 43 days in November, the highest all year.
There are two dynamics at play, each contributing to the rise in this metric:
- Selection bias: Long under-water NFTs were finally being offloaded.
- Future expectations bias: Buyers are holding onto their NFTs longer because they expect prices to rise in the future.
Either way, this is indicative of how participants view the market - a definitive change in direction from bear to bull.
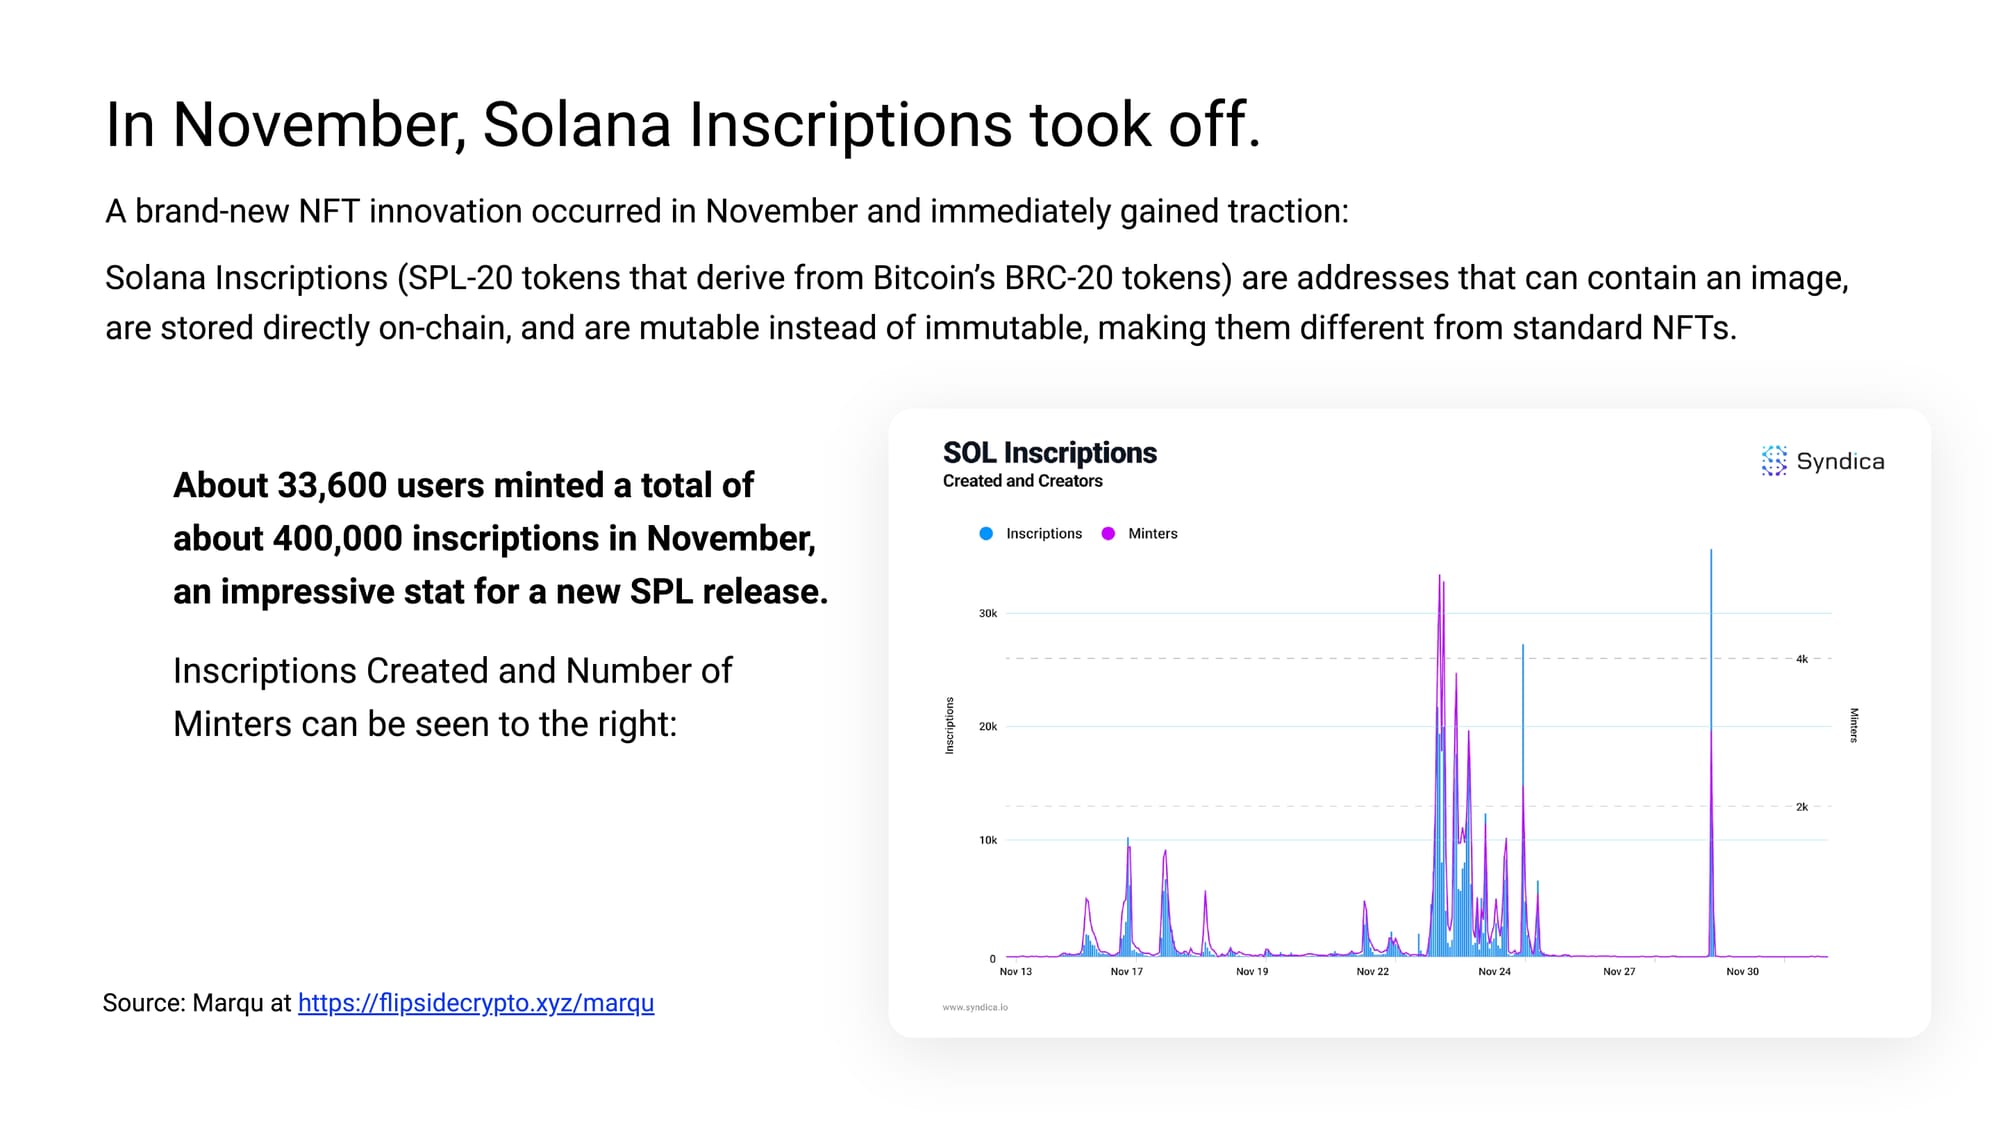
In November, Solana Inscriptions took off.
A brand-new NFT innovation occurred in November and immediately gained traction:
Solana Inscriptions (SPL-20 tokens that derive from Bitcoin’s BRC-20 tokens) are addresses that can contain an image, are stored directly on-chain, and are mutable instead of immutable, making them different from standard NFTs.
About 33,600 users minted a total of about 400,000 inscriptions in November, an impressive stat for a new SPL release.
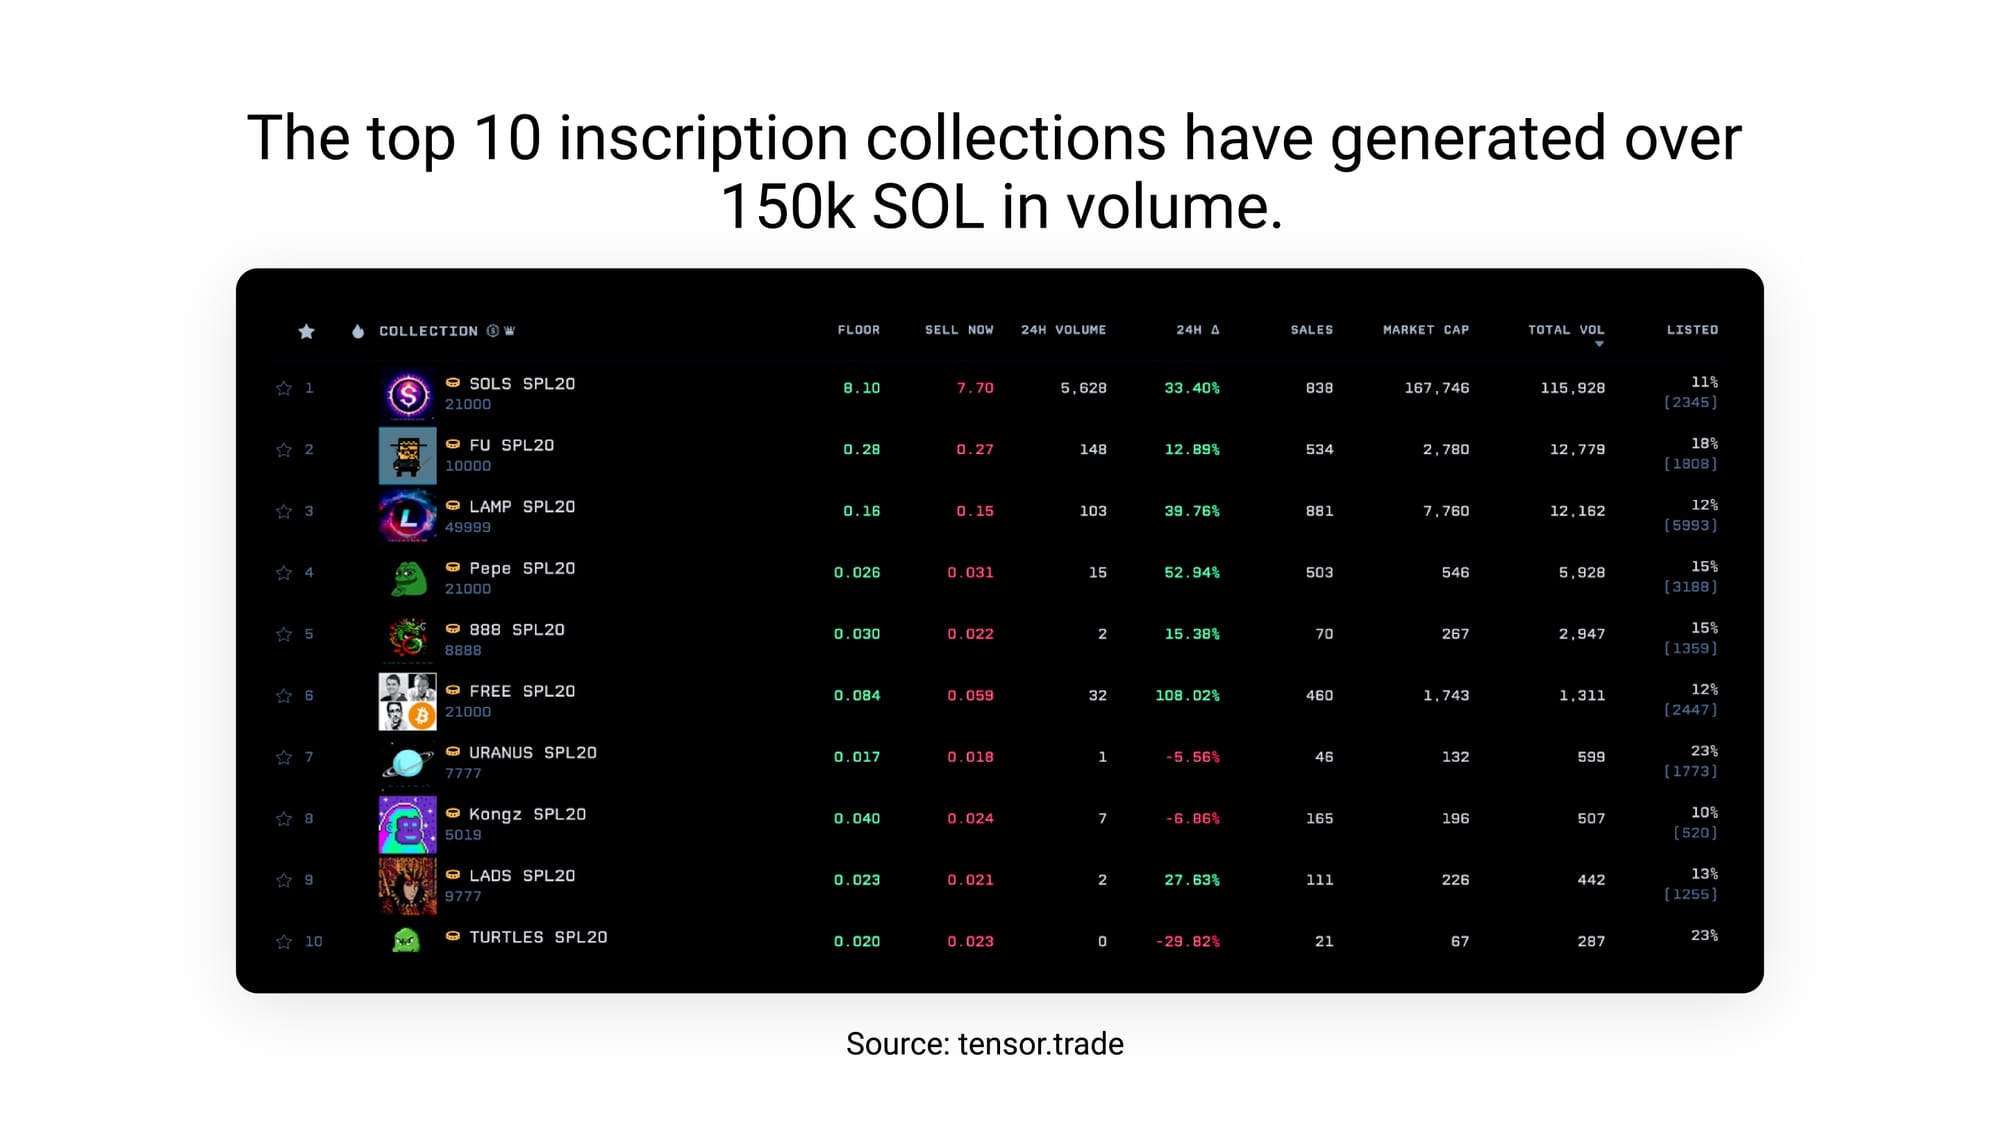
The top 10 inscription collections have generated over 150k SOL in volume.
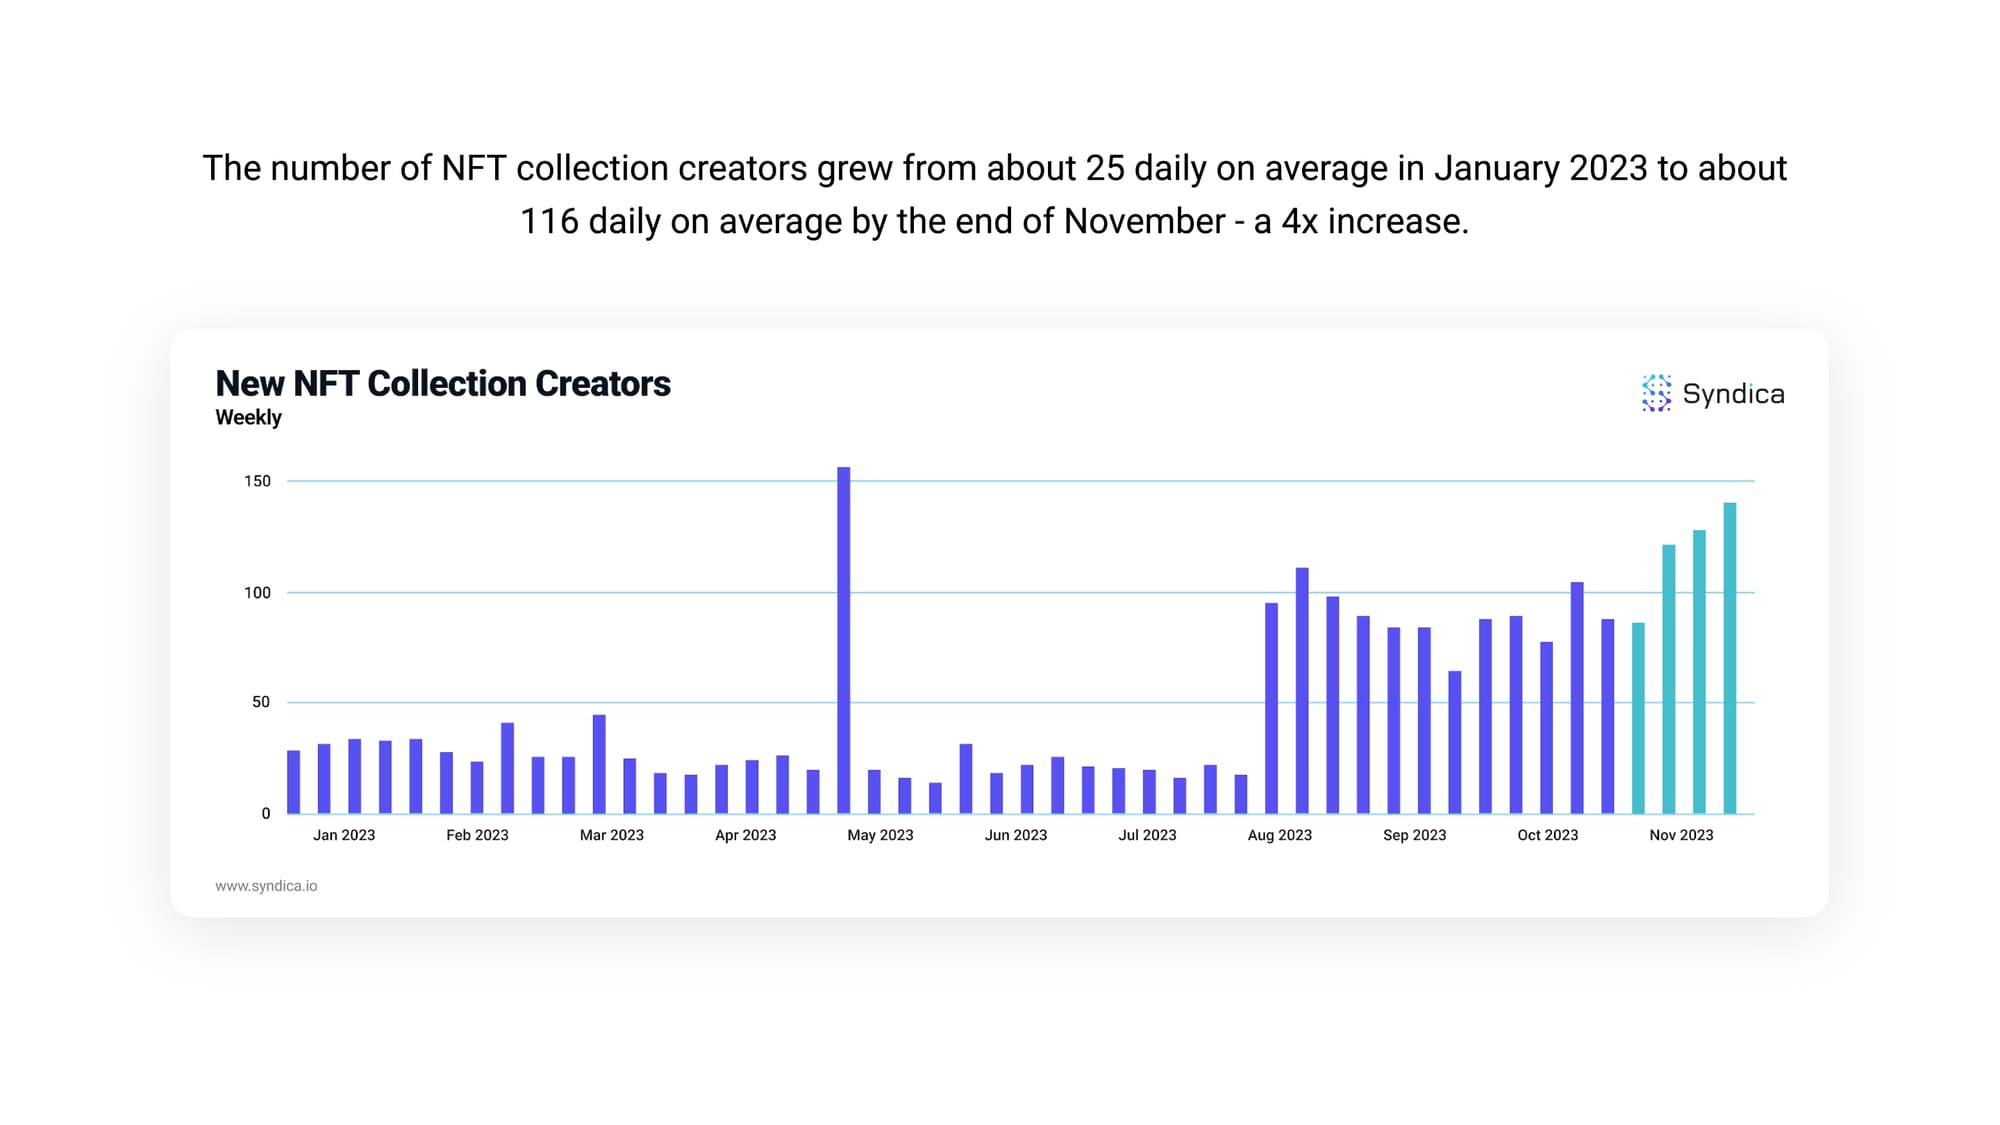
The number of NFT collection creators grew from about 25 daily on average in January 2023 to about 116 daily on average by the end of November - a 4x increase.
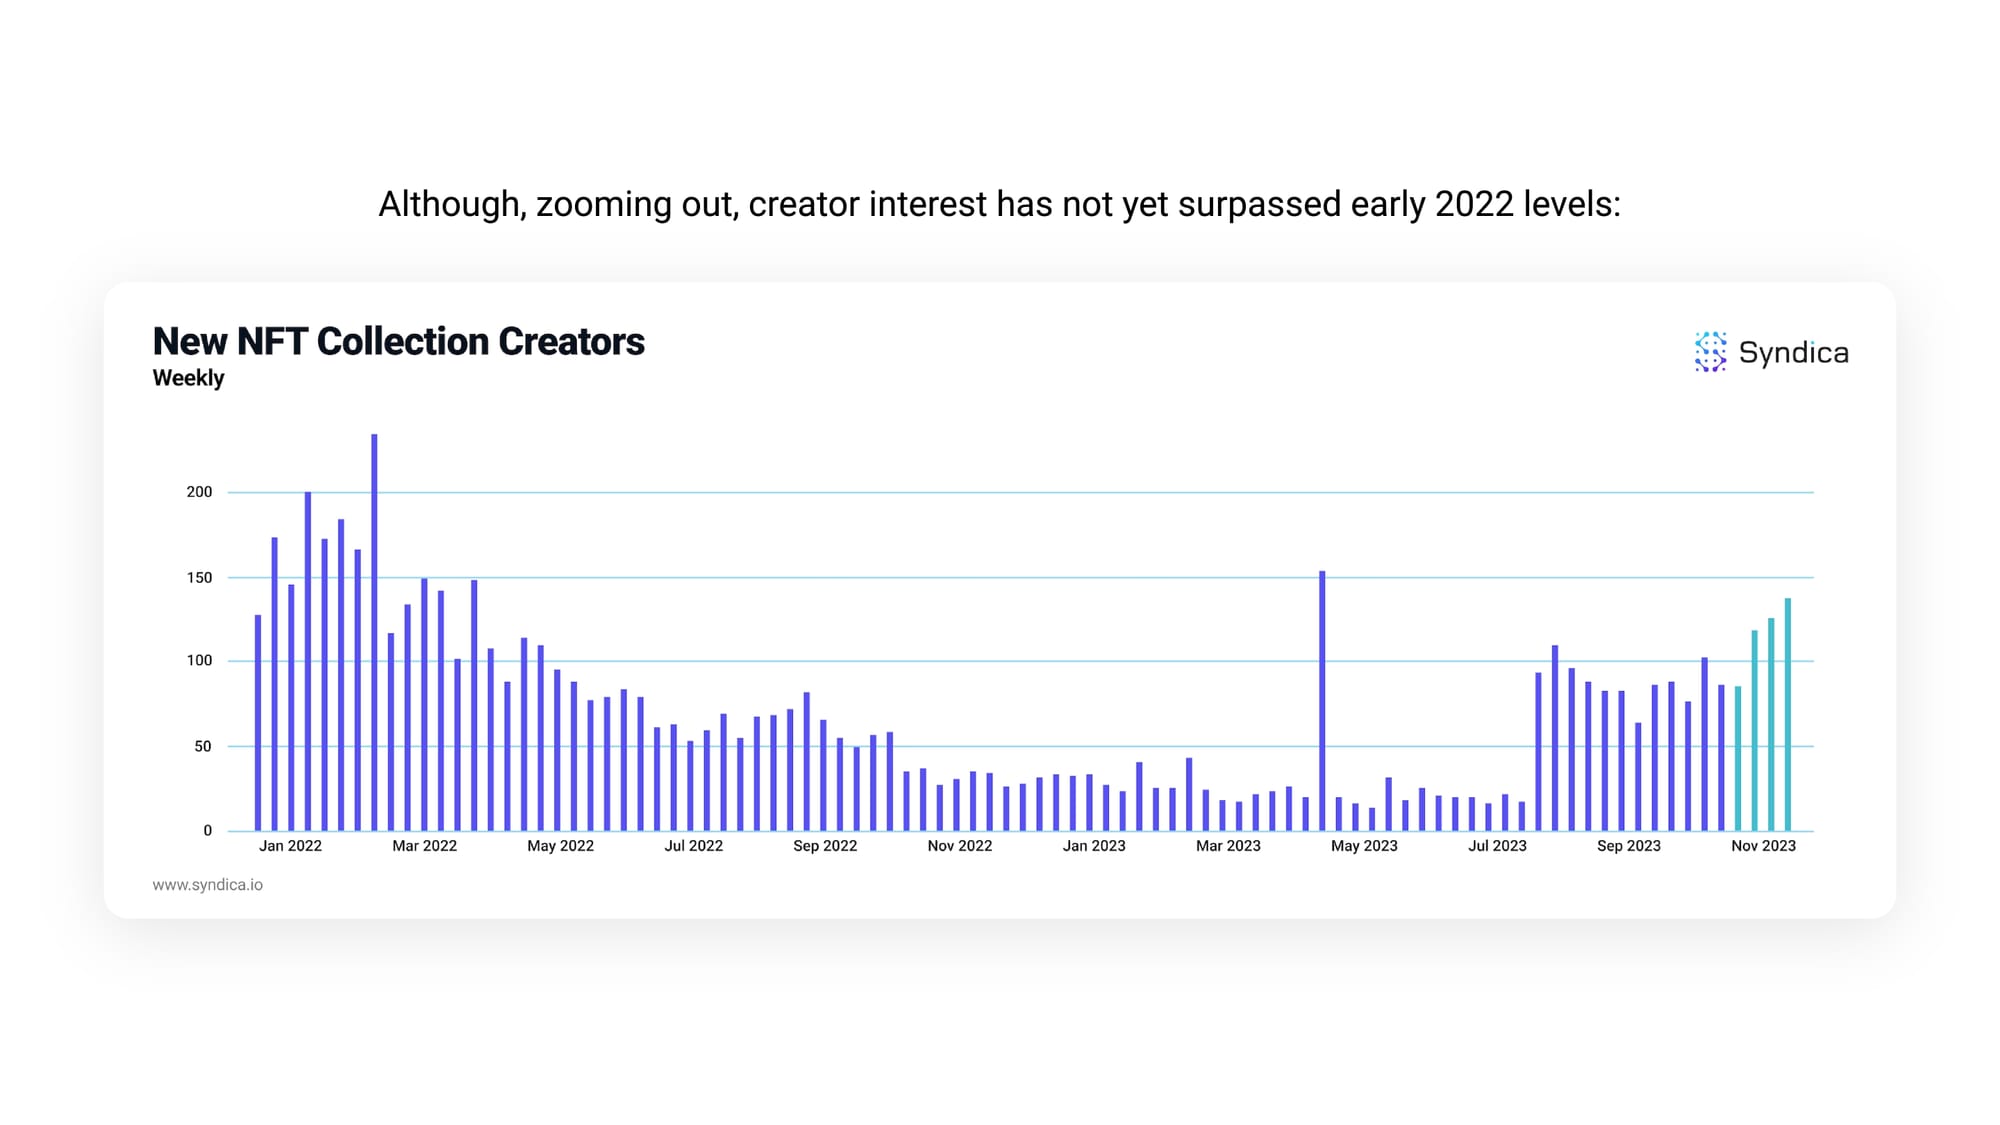
Although, zooming out, creator interest has not yet surpassed early 2022 levels.
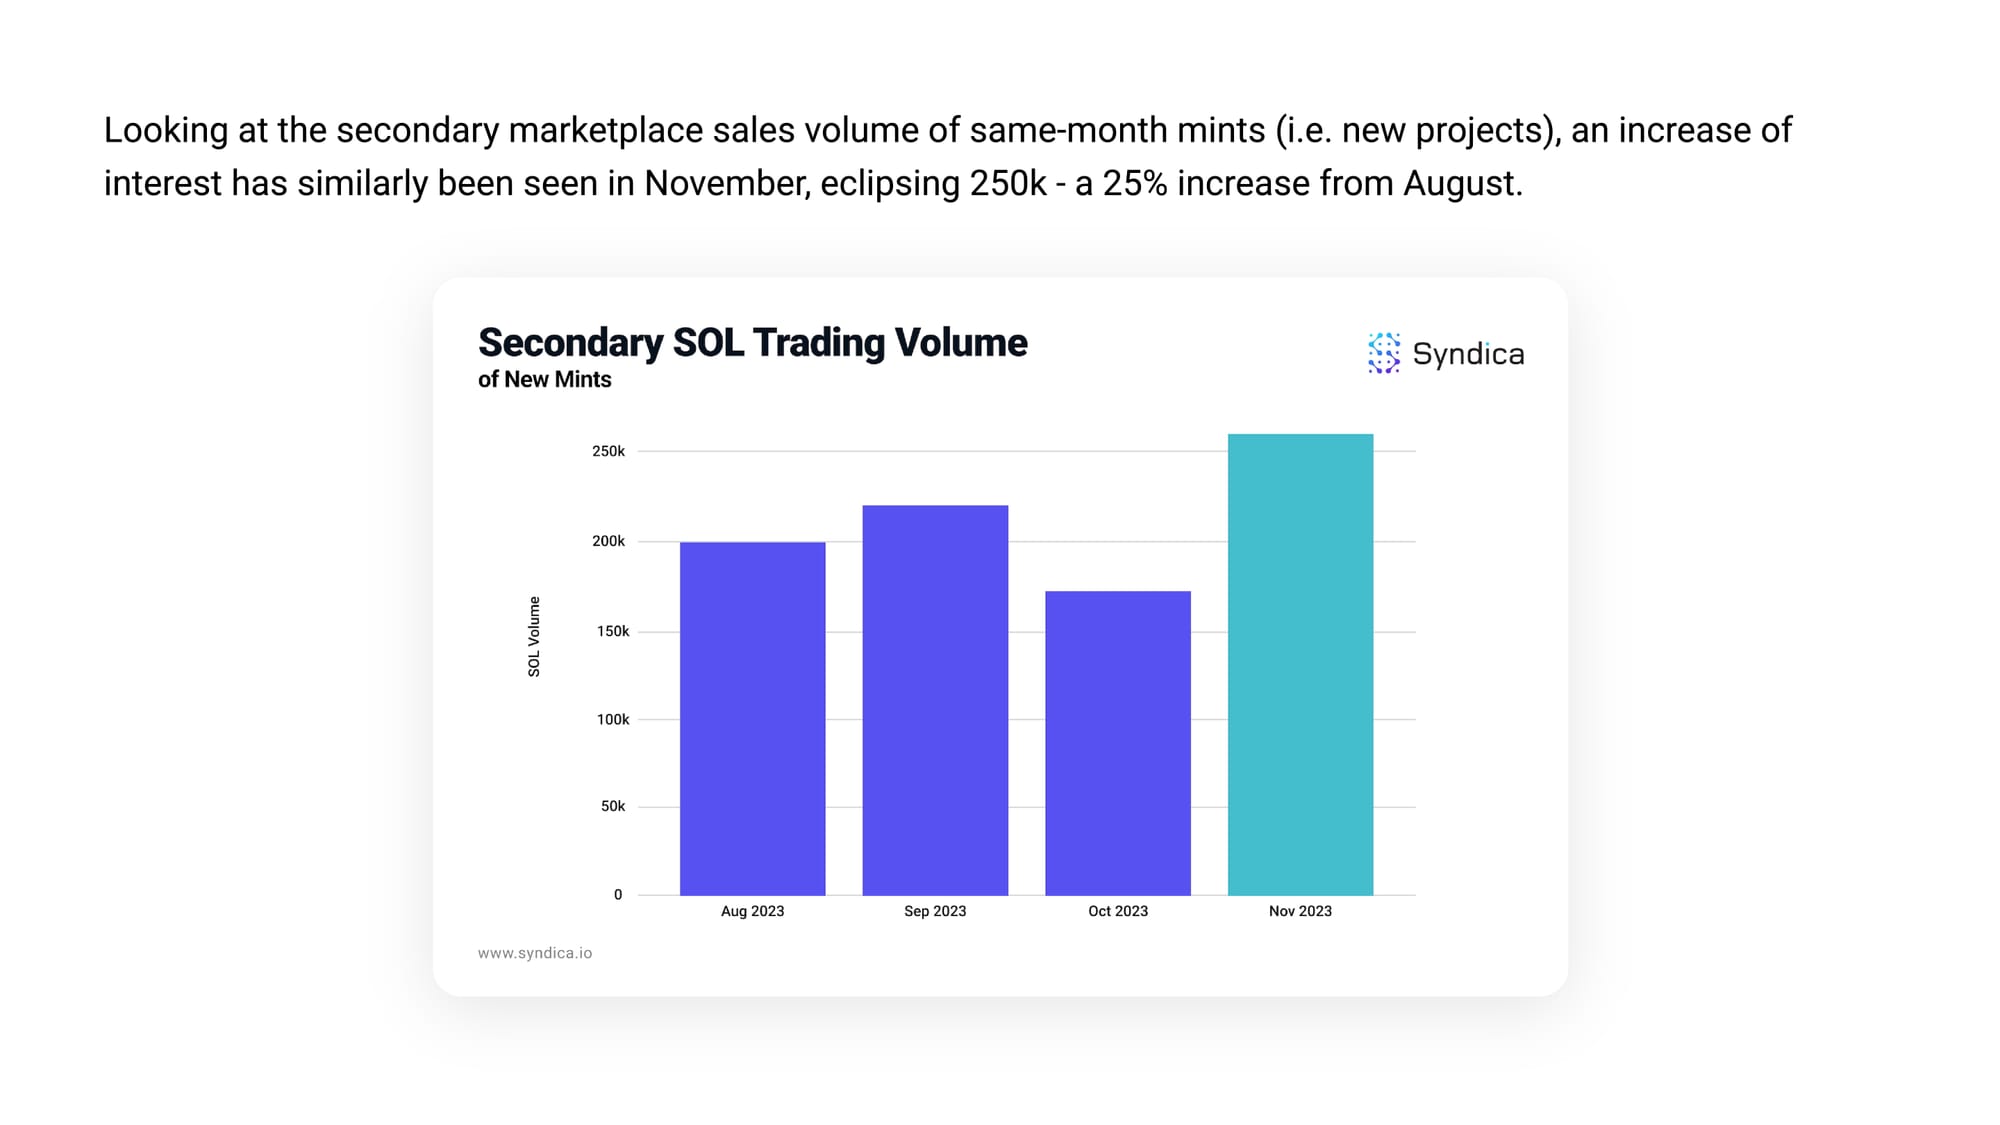
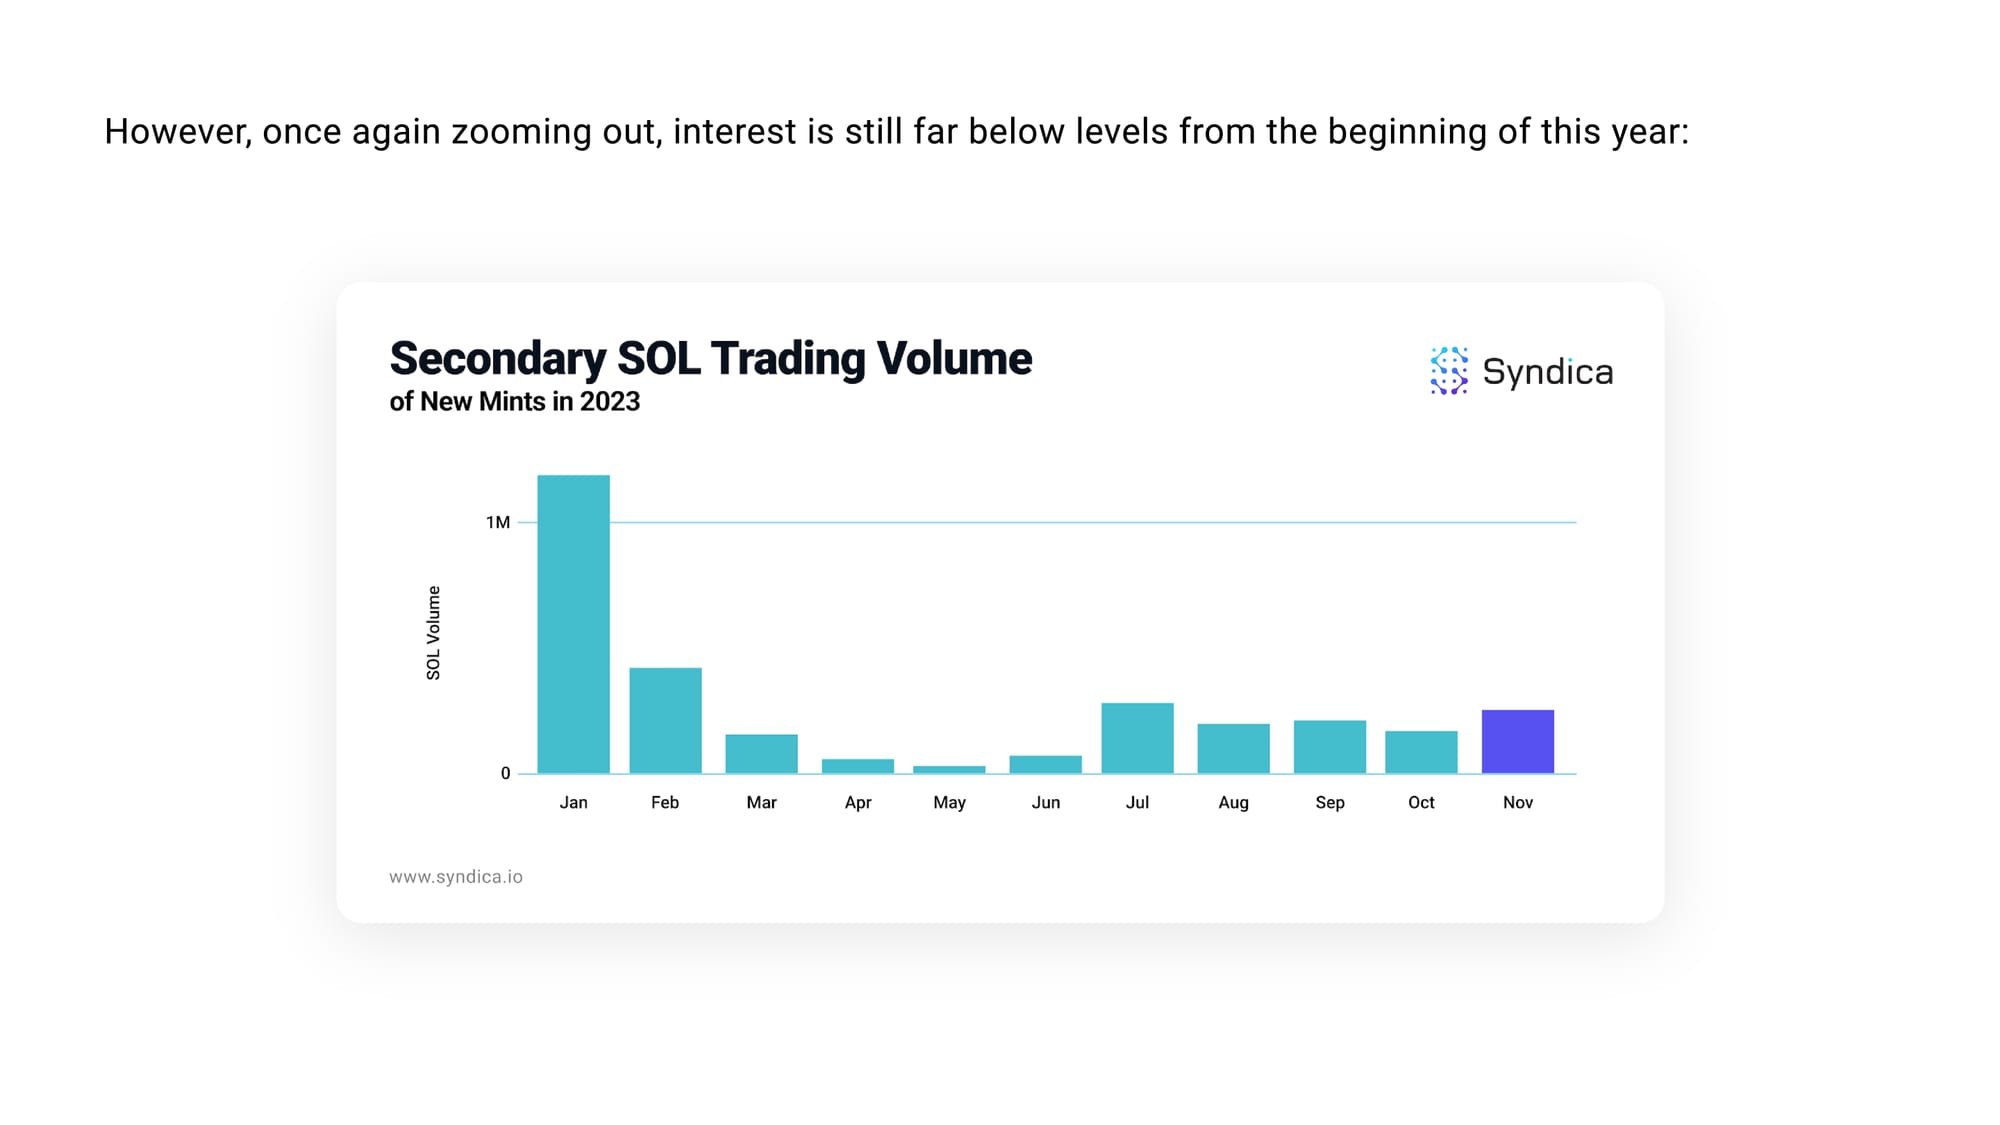
Looking at the secondary marketplace sales volume of same-month mints (i.e. new projects), an increase of interest has similarly been seen in November, eclipsing 250k - a 25% increase from August.
However, once again zooming out, interest is still far below levels from the beginning of this year.
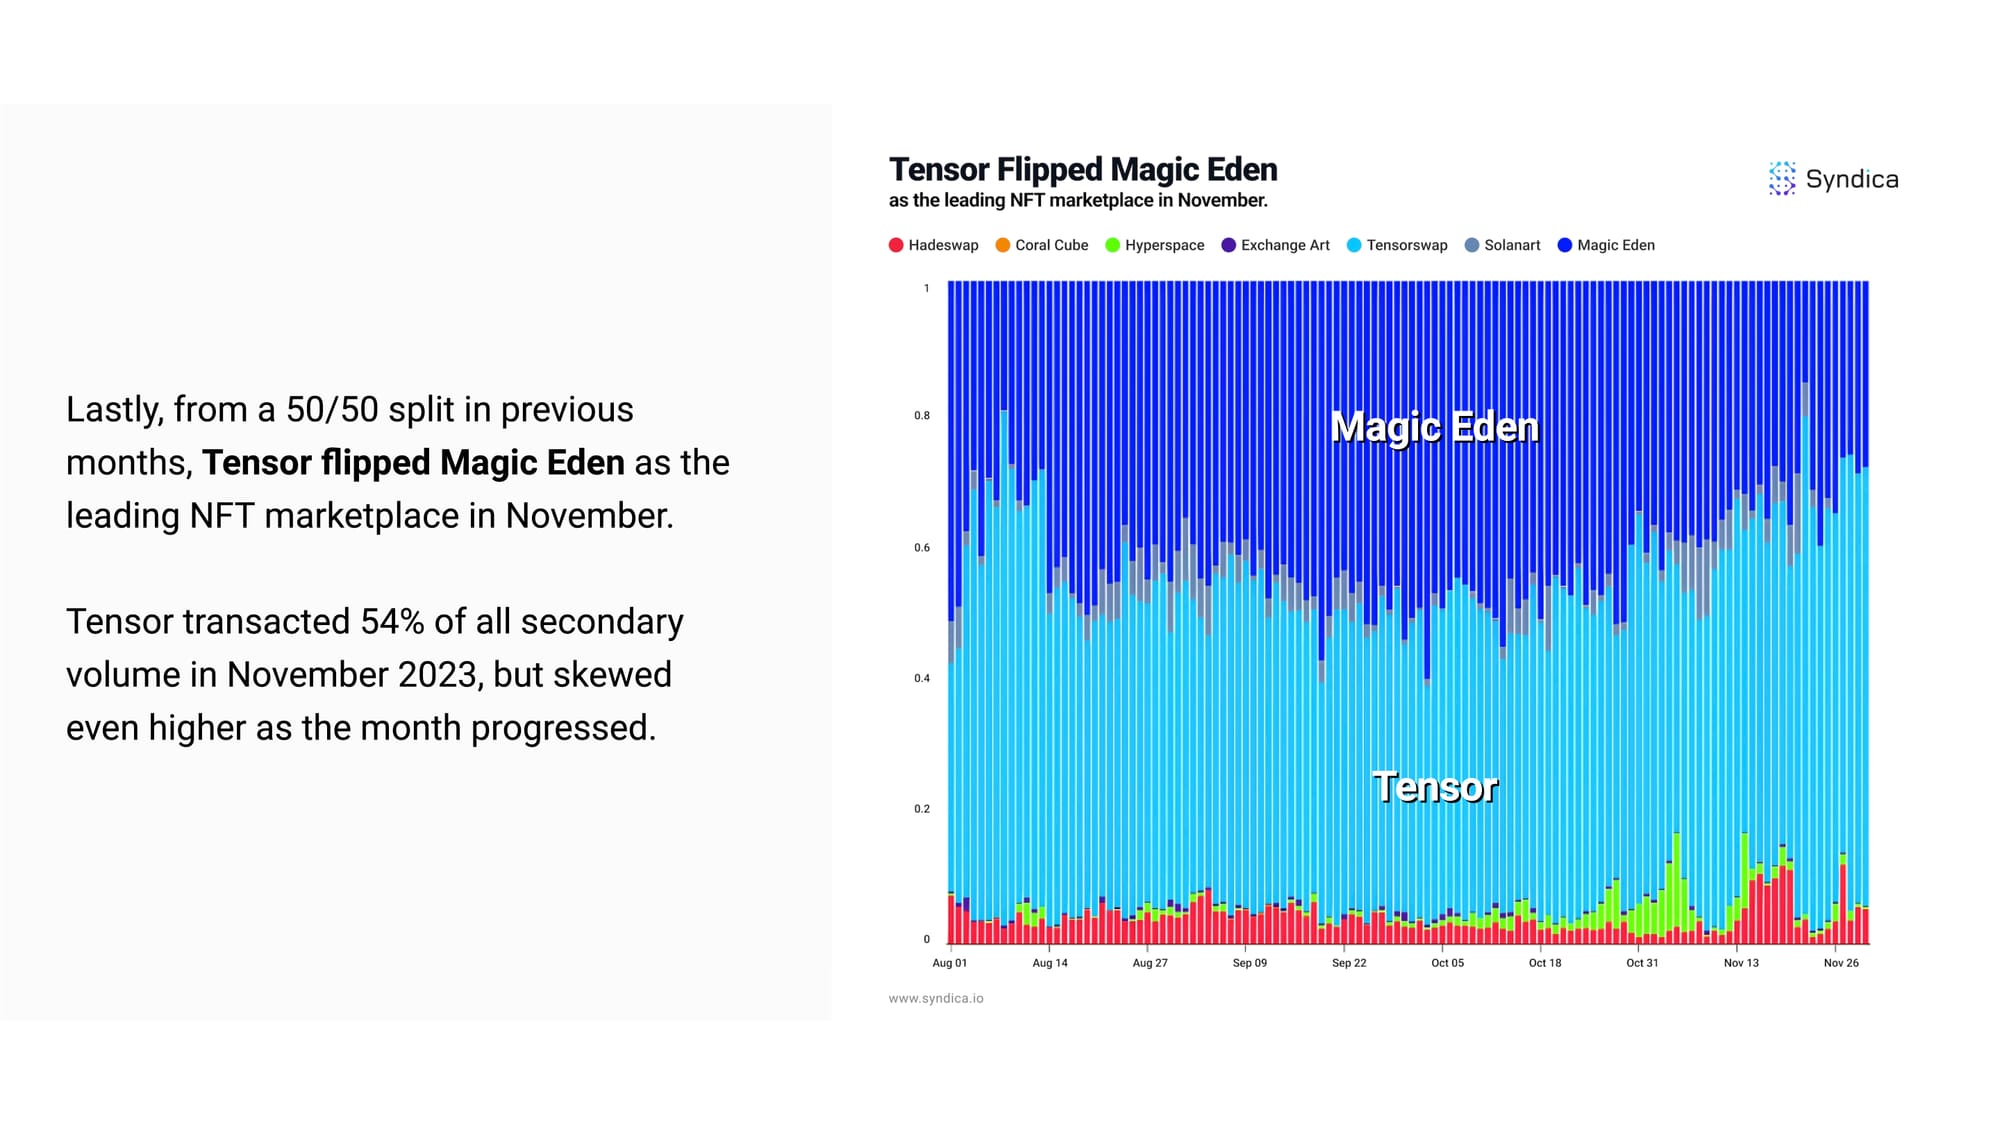
Lastly, from a 50/50 split in previous months, Tensor flipped Magic Eden as the leading NFT marketplace in November.
Tensor transacted 54% of all secondary volume in November 2023, but skewed even higher as the month progressed.
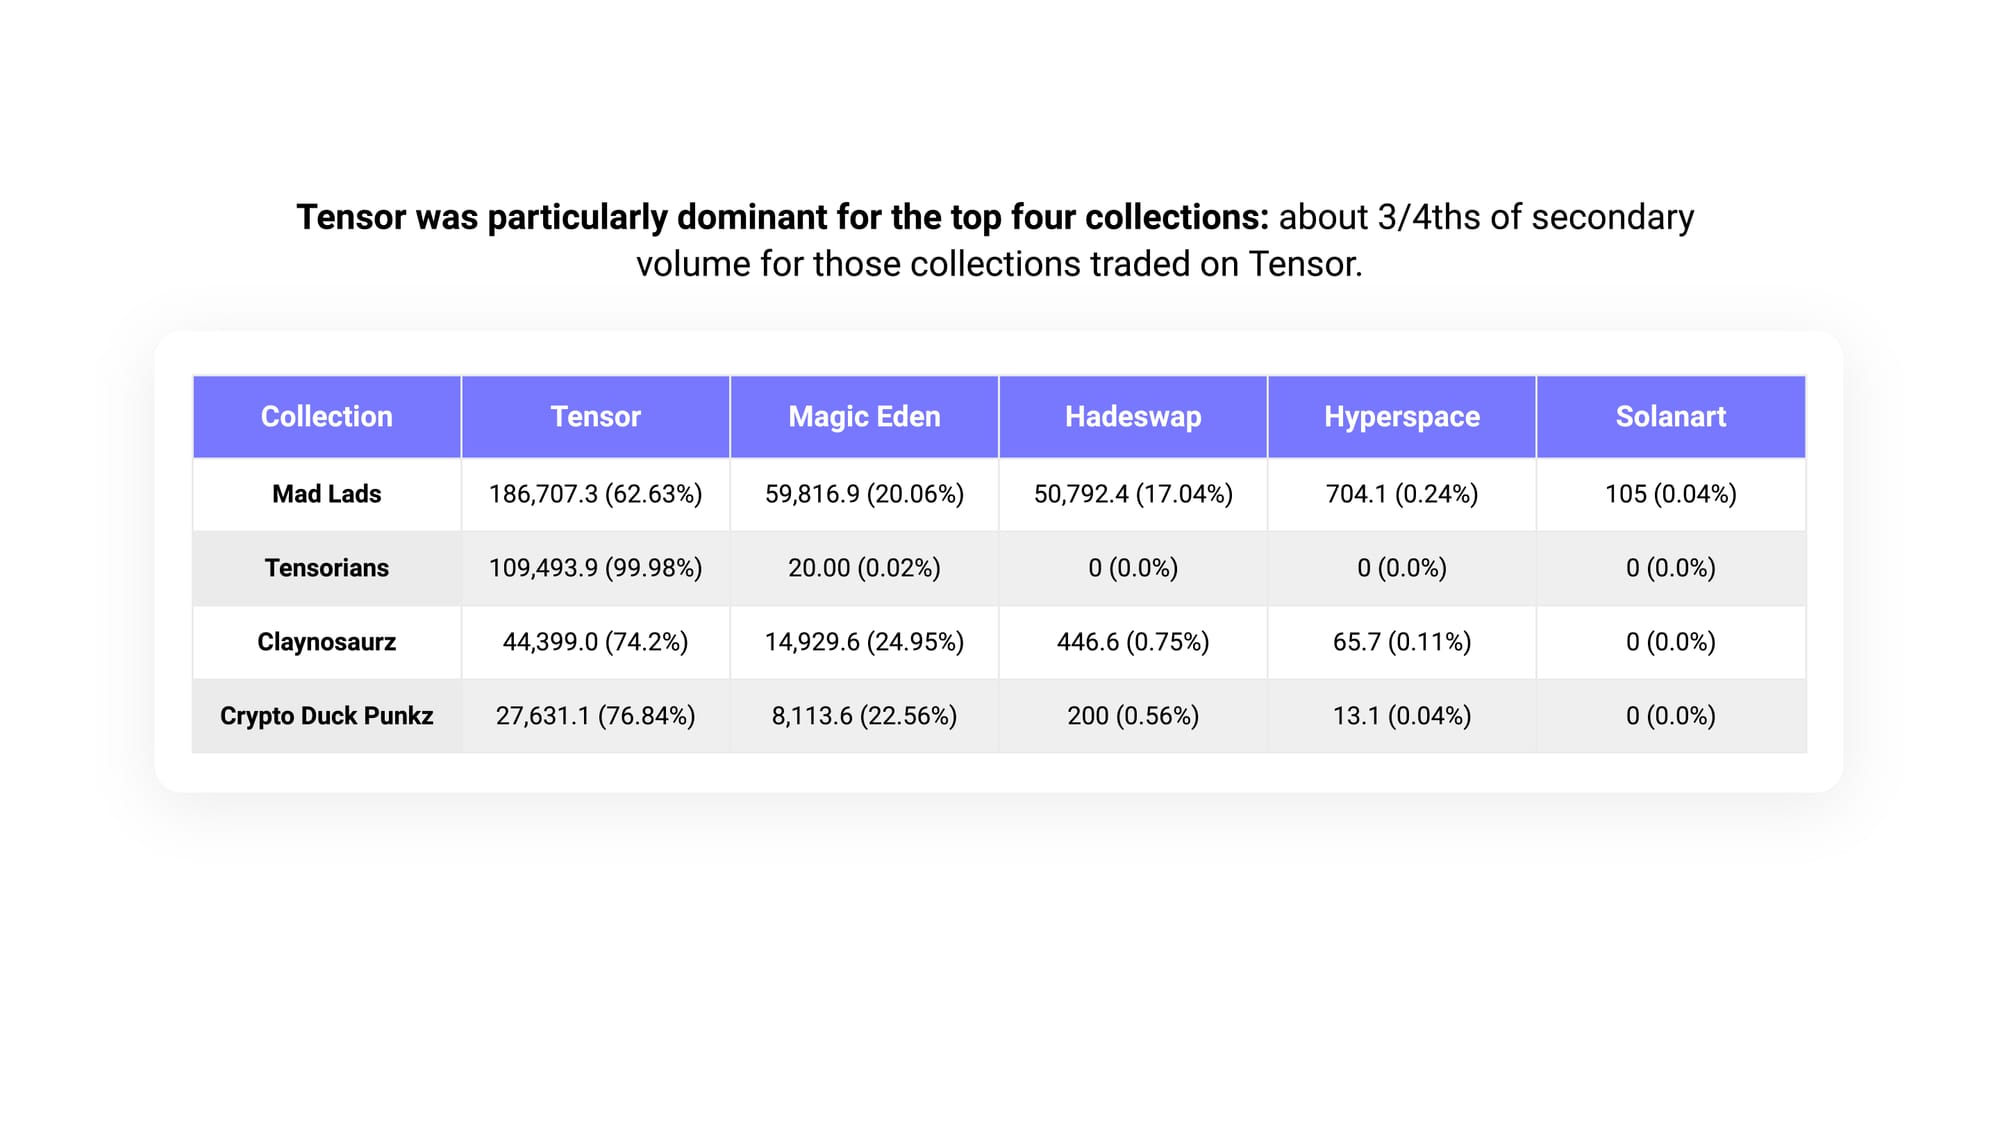
Tensor was particularly dominant for the top four collections: about 3/4ths of secondary volume for those collections traded on Tensor.

